By Miriam King, Devon Kristiansen, and Anna Bolgrien
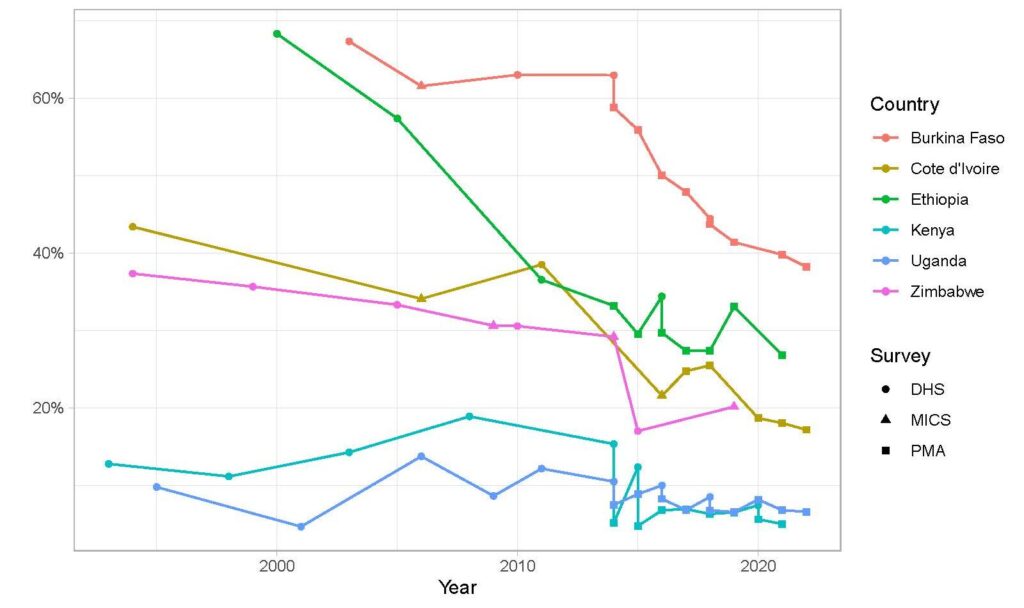
IPUMS Global Health includes integrated data from three international health surveys: Demographic and Health Surveys (IPUMS DHS), Multiple Indicator Cluster Surveys (IPUMS MICS), and Performance Monitoring for Action (IPUMS PMA). All three surveys are nationally representative, primarily focus on low- and middle-income countries, and address issues related to the health and well-being of women and young children. These commonalities make combining integrated data across these data collections appealing. As Figure 1 shows, IPUMS DHS and IPUMS MICS cover different countries; combining them extends the geographic coverage of harmonized versions of data covering similar topics. Researchers can also combine data for those countries included in both IPUMS DHS and IPUMS MICS to provide additional observation points for time-series analyses.
Figure 1: Countries covered by IPUMS DHS and IPUMS MICS
Researchers who want to carry out cross-survey analyses face practical challenges. IPUMS imposes consistent variable names and codes within one kind of survey (DHS, MICS, or PMA); harmonized variable names and codes differ between these surveys. On each project’s website, the documentation for each variable highlights comparability issues to keep in mind when combining multiple samples, either within one type of survey or across survey types. IPUMS users must make separate customized data files from each database and merge those files. And subtle differences in question wording, skip patterns, geographic boundaries, and sampling procedures—such as MICS’ taking reports on child health from caretakers other than the biological mother—can introduce inconsistencies and inadvertent errors.
Over 95 percent of surveyed IPUMS Global Health users want guidance on combining data across the three surveys, and IPUMS staff are addressing that demand. First, we are offering new interoperable Global Health (_GH) variables with the same variable names and codes in IPUMS DHS, IPUMS MICS, and IPUMS PMA. While harmonized variable codes in IPUMS usually retain all detail across samples, the Global Health variables recognize broad categories (e.g., never married/currently in union/formerly in union) or yes/no responses. Our initial Global Health variables relate to women and households, but we will extend the number and scope of these variables. Learn about using the interoperable Global Health variables here, and email ipums@umn.edu to suggest other topics for us to prioritize when adding Global Health variables.
Second, we are sharing general guidelines about pitfalls and solutions for conducting cross-survey-type research using IPUMS data. An earlier IPUMS blog post laid out some of these issues using indicators of intimate partner violence as an example. On March 19, 2025 hosted a webinar on “Challenges and Solutions to Combining Data from IPUMS Global Health Surveys.” The webinar, slides, and a written document of the questions and answers from the webinar are available to view at your convenience on the IPUMS Tutorials page.
While combining data across global health surveys requires additional recoding work, IPUMS simplifies that work in two ways. First, it is easier to combine two sets of integrated codes than to recode data from multiple surveys that all have their own distinct codes. Second, IPUMS’ online variable-specific documentation on question wording, universes (to whom the question applies), and response categories makes it easy to see subtle differences—not only between samples within one survey type, but also between samples across survey types.
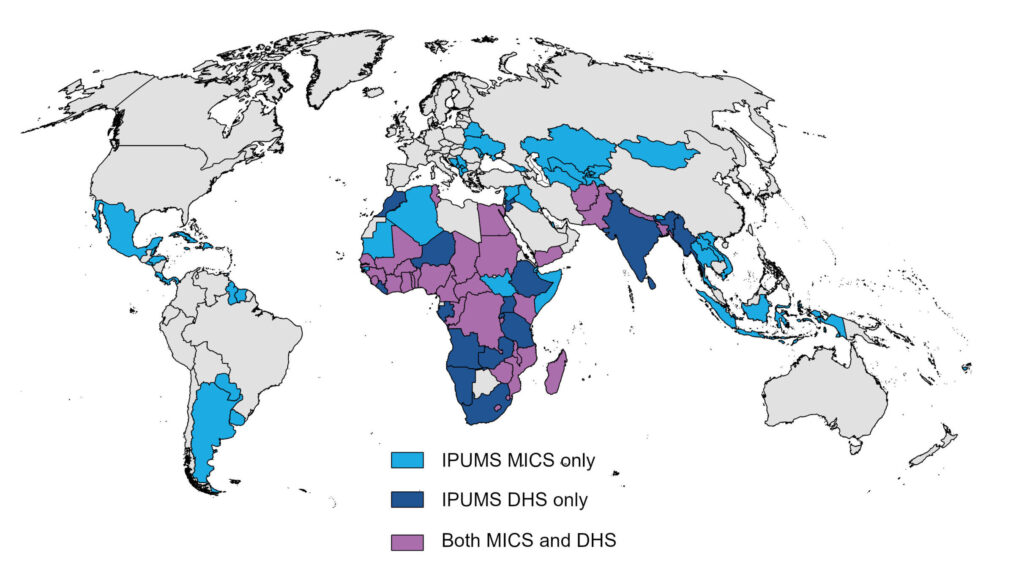
For researchers who want to study many countries across long time periods, combining data across the IPUMS Global Health Surveys is worth the effort. Consider Figure 2, which shows, for selected Sub-Saharan countries, the prevalence of improved sanitation facilities over time. Without data from all three Global Health Surveys, the time series would be more sparse and less informative.
Figure 2: Percent of households lacking toilet facilities in selected Sub-Saharan countries