
By Etienne Breton
We recently updated a key IPUMS-constructed variable for understanding multigenerational households: MULTGEN, which identifies the number of generations in a household. This variable is needed to answer important questions in our era of rapid population aging. For example, do multigenerational households become more numerous during economic recessions, and if so for whom exactly? Can they buffer against physical and cognitive decline for older adults? Do young people living with their grandparents have distinct educational, professional or even health trajectories? All of these questions – and many more – can be investigated creatively and rigorously using MULTGEN.
MULTGEN has long been available for most IPUMS USA samples. We recently adapted our methodology to add this variable to IPUMS CPS for all samples from January 1994 to the present. This means that users can now research multigenerational households with another IPUMS data collection, tackling key research questions with added precision and contextual richness, in addition to analysis of topics in the CPS that are not covered in the ACS (e.g., tobacco use, volunteering, voting and registration).
The construction of MULTGEN in IPUMS CPS (as in IPUMS USA) relies on IPUMS family interrelationship variables (see this classic paper, or this more recent paper, or our user guide, for how these variables are constructed) and information from the variable RELATE (insufficient information in the RELATE variable before 1994 explains why MULTGEN is not available for older samples). At present, MULTGEN in IPUMS CPS only provides general codes about the number of generations per household, whereas MULTGEN in IPUMS USA also provides detailed codes identifying subtypes of 2-generations and 3+ generations households.
Importantly, the new availability of MULTGEN for CPS enables direct comparisons of estimates of multigenerational households between the ACS, BMS and ASEC. The figures below show estimates of MULTGEN in these surveys from 1994 to the present using harmonized household weights (HHWT for the ACS, HWTFINL for the BMS, and ASECWTH for the ASEC). Figure 1 and 2 convey the same overall story: there has been a decline in the proportion of two-generation households coupled with an increase in the proportion of one-generation households in recent decades.
Figure 1 – Percent of One-Generation Households in Major US Population Surveys, 1994-2025
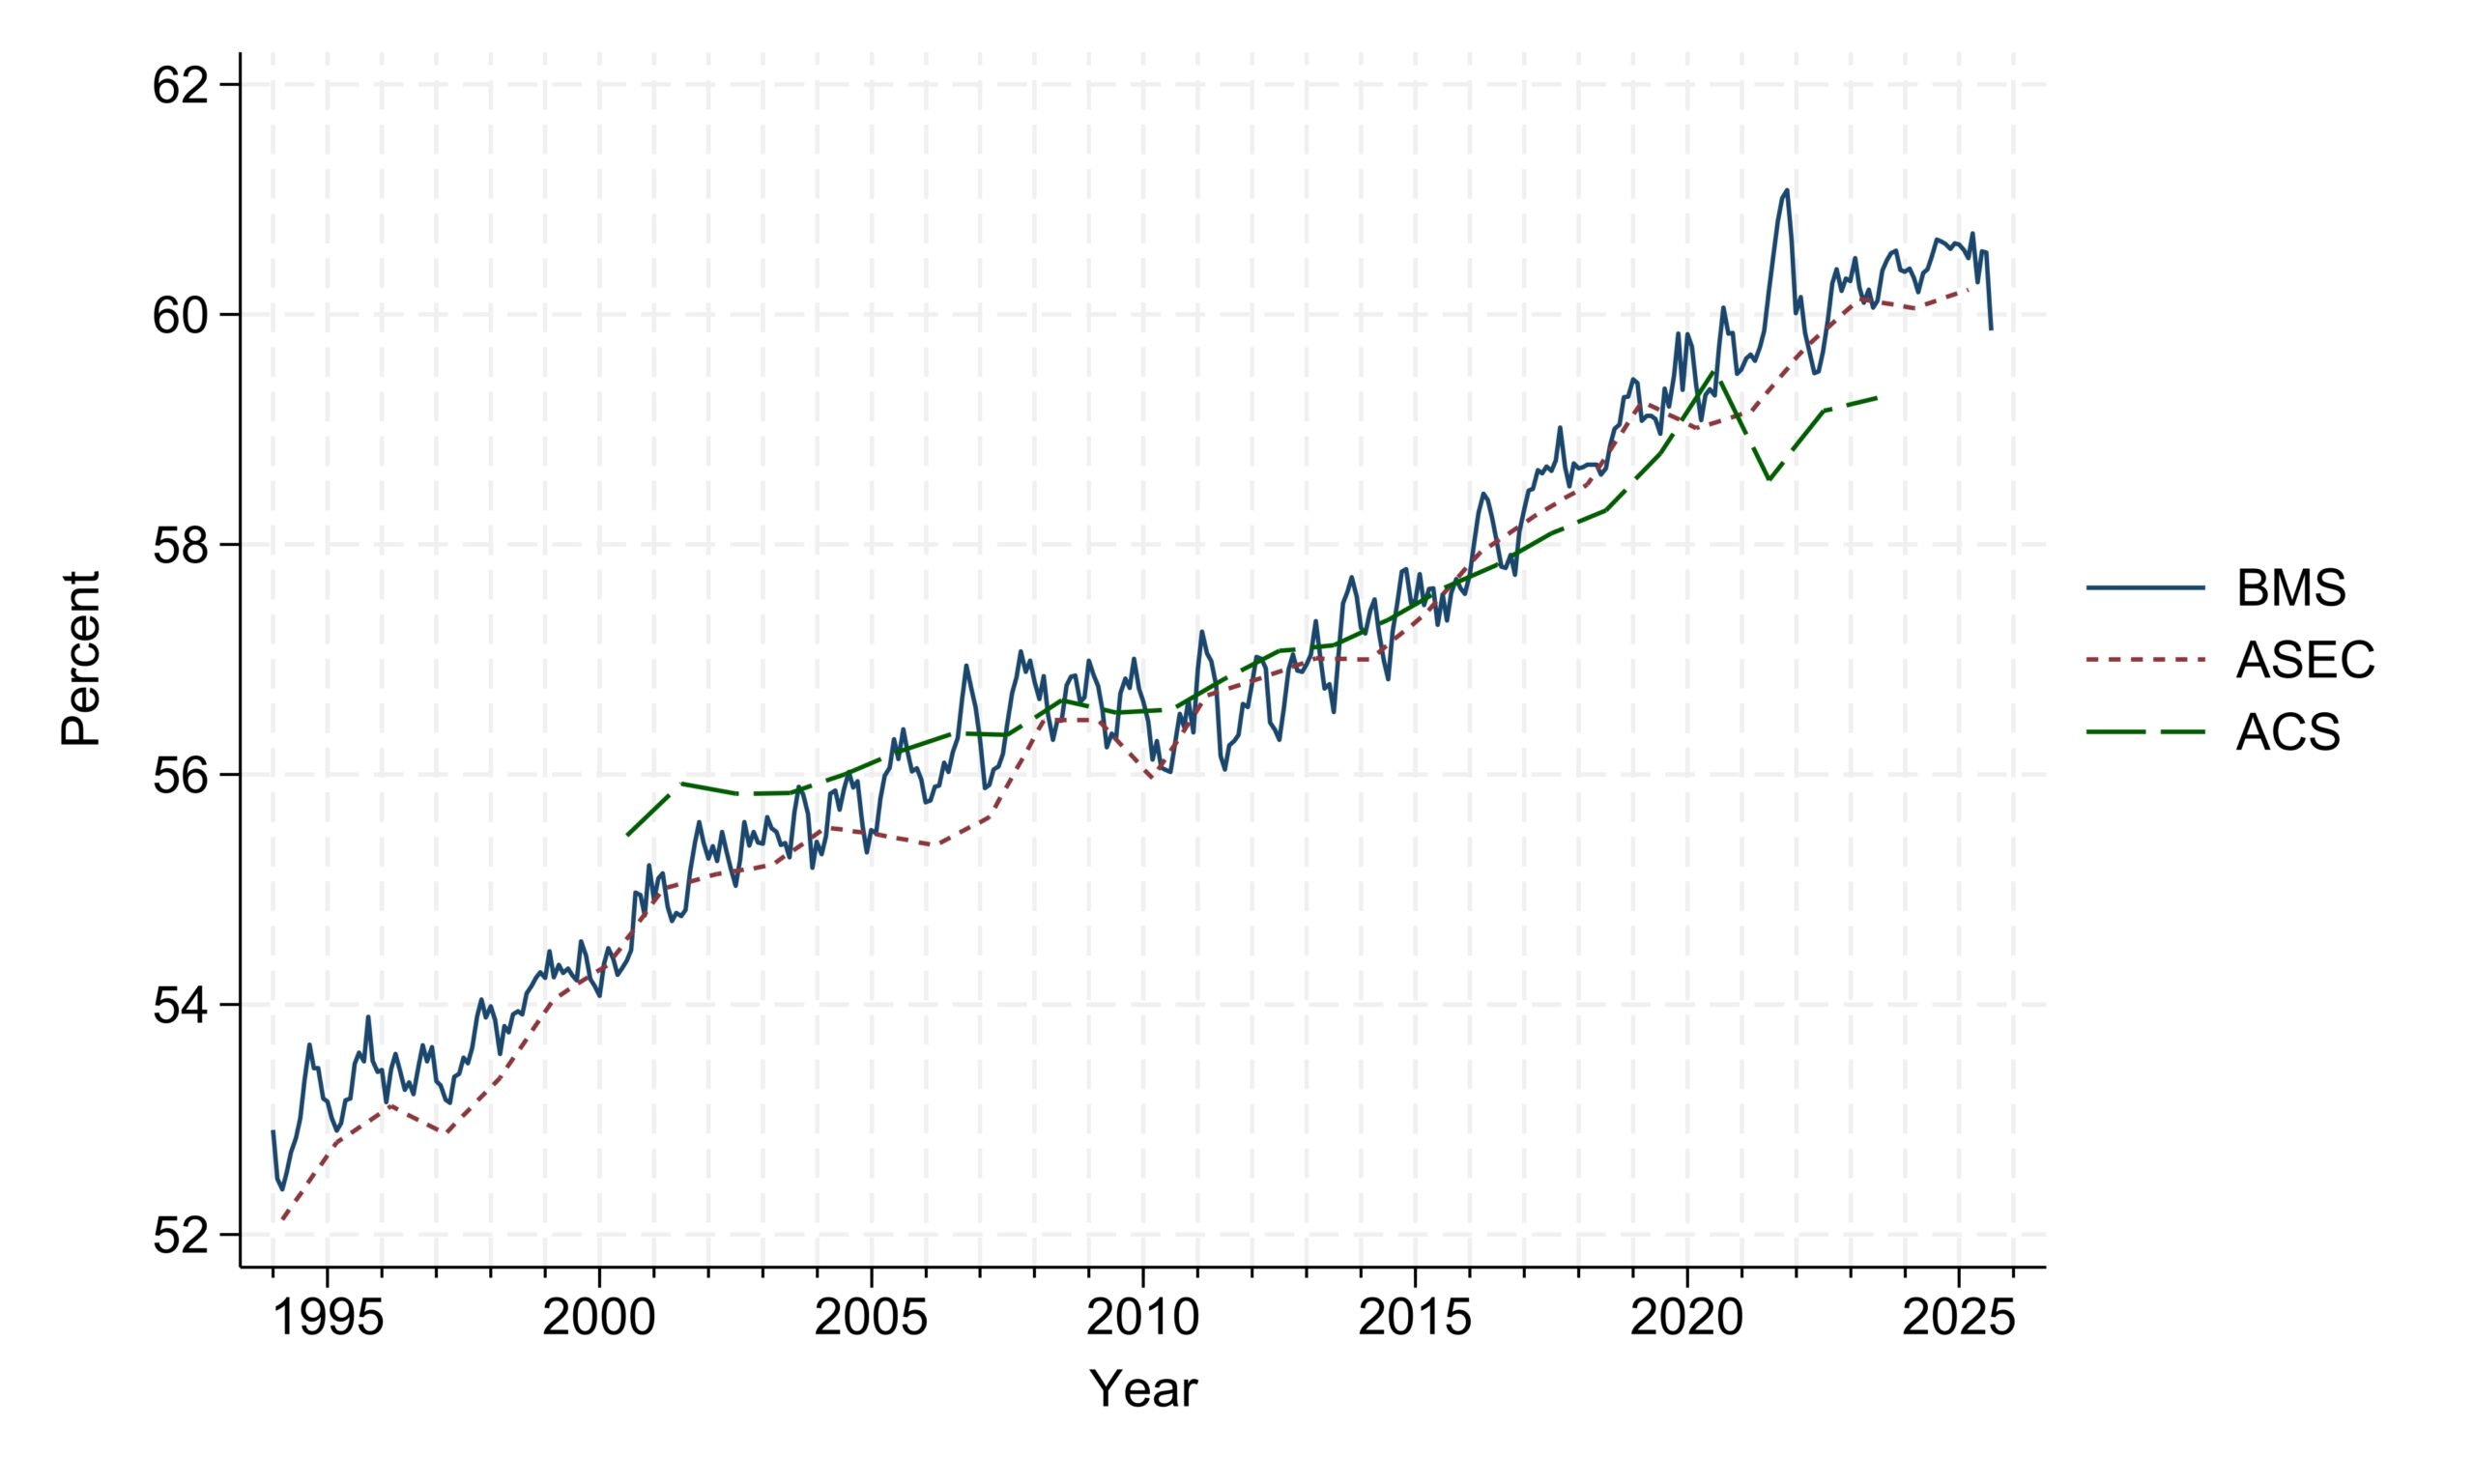
Figure 2 – Percent of Two-Generation Households in Major US Population Surveys, 1994-2025
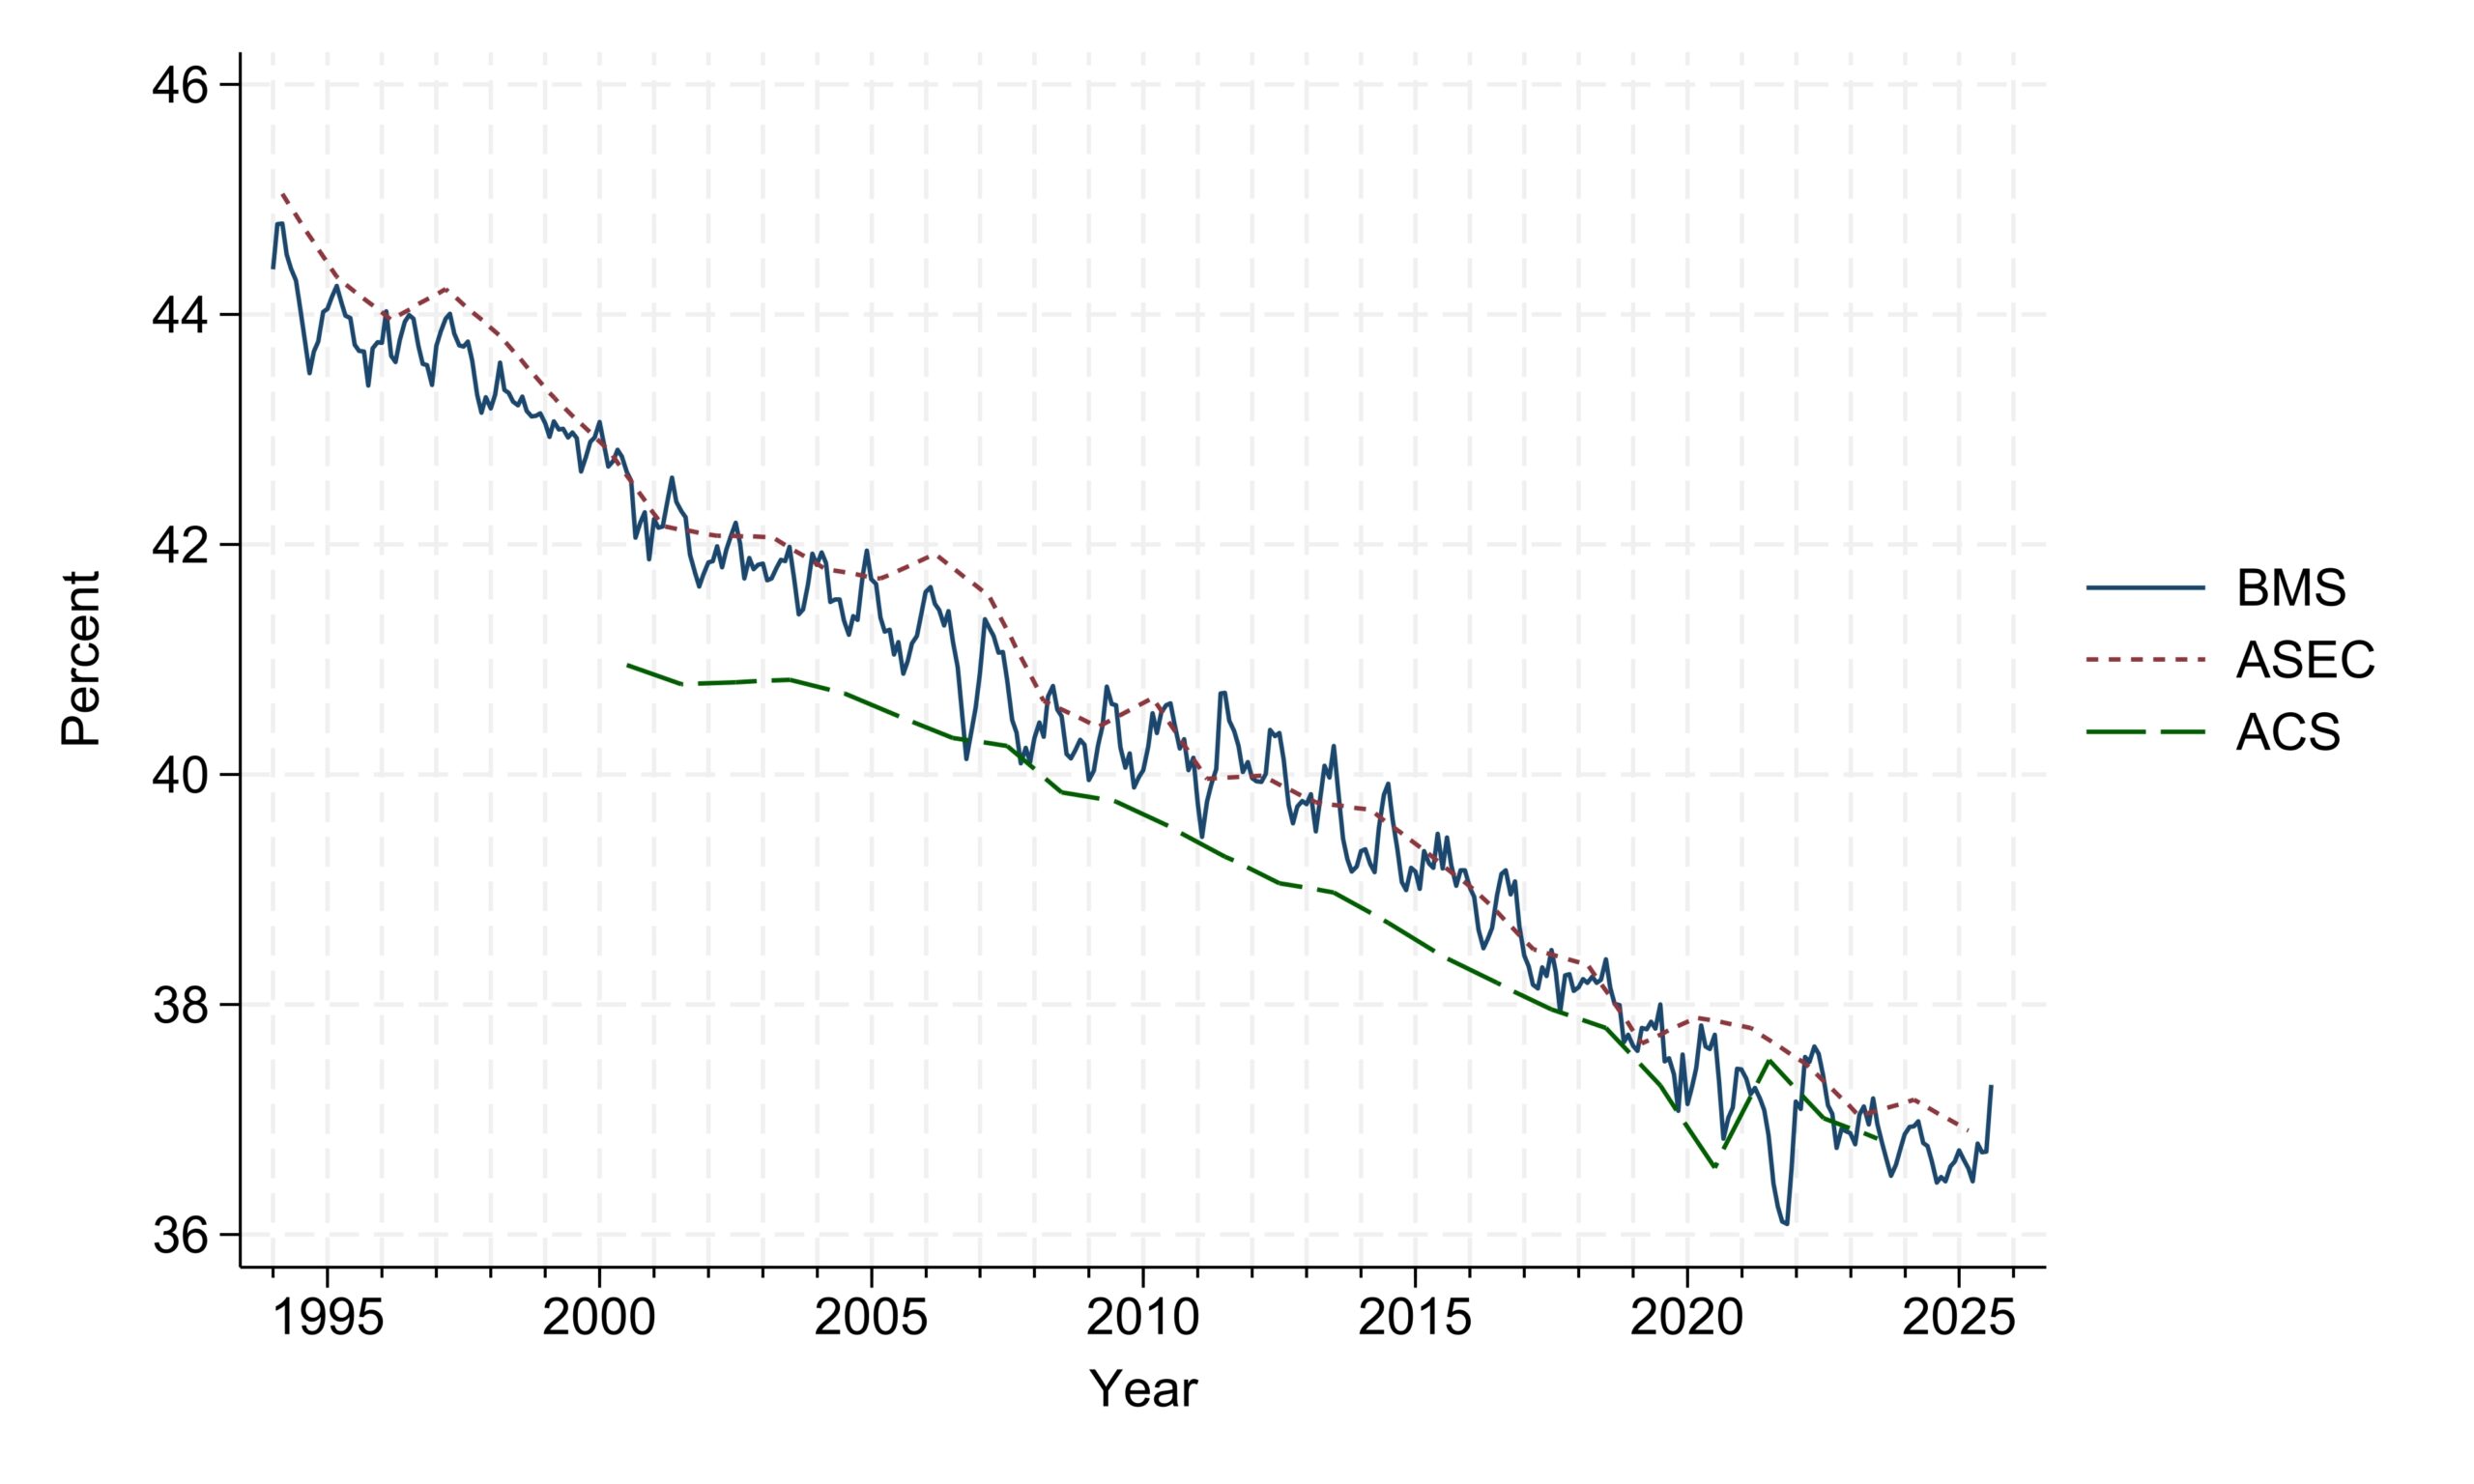
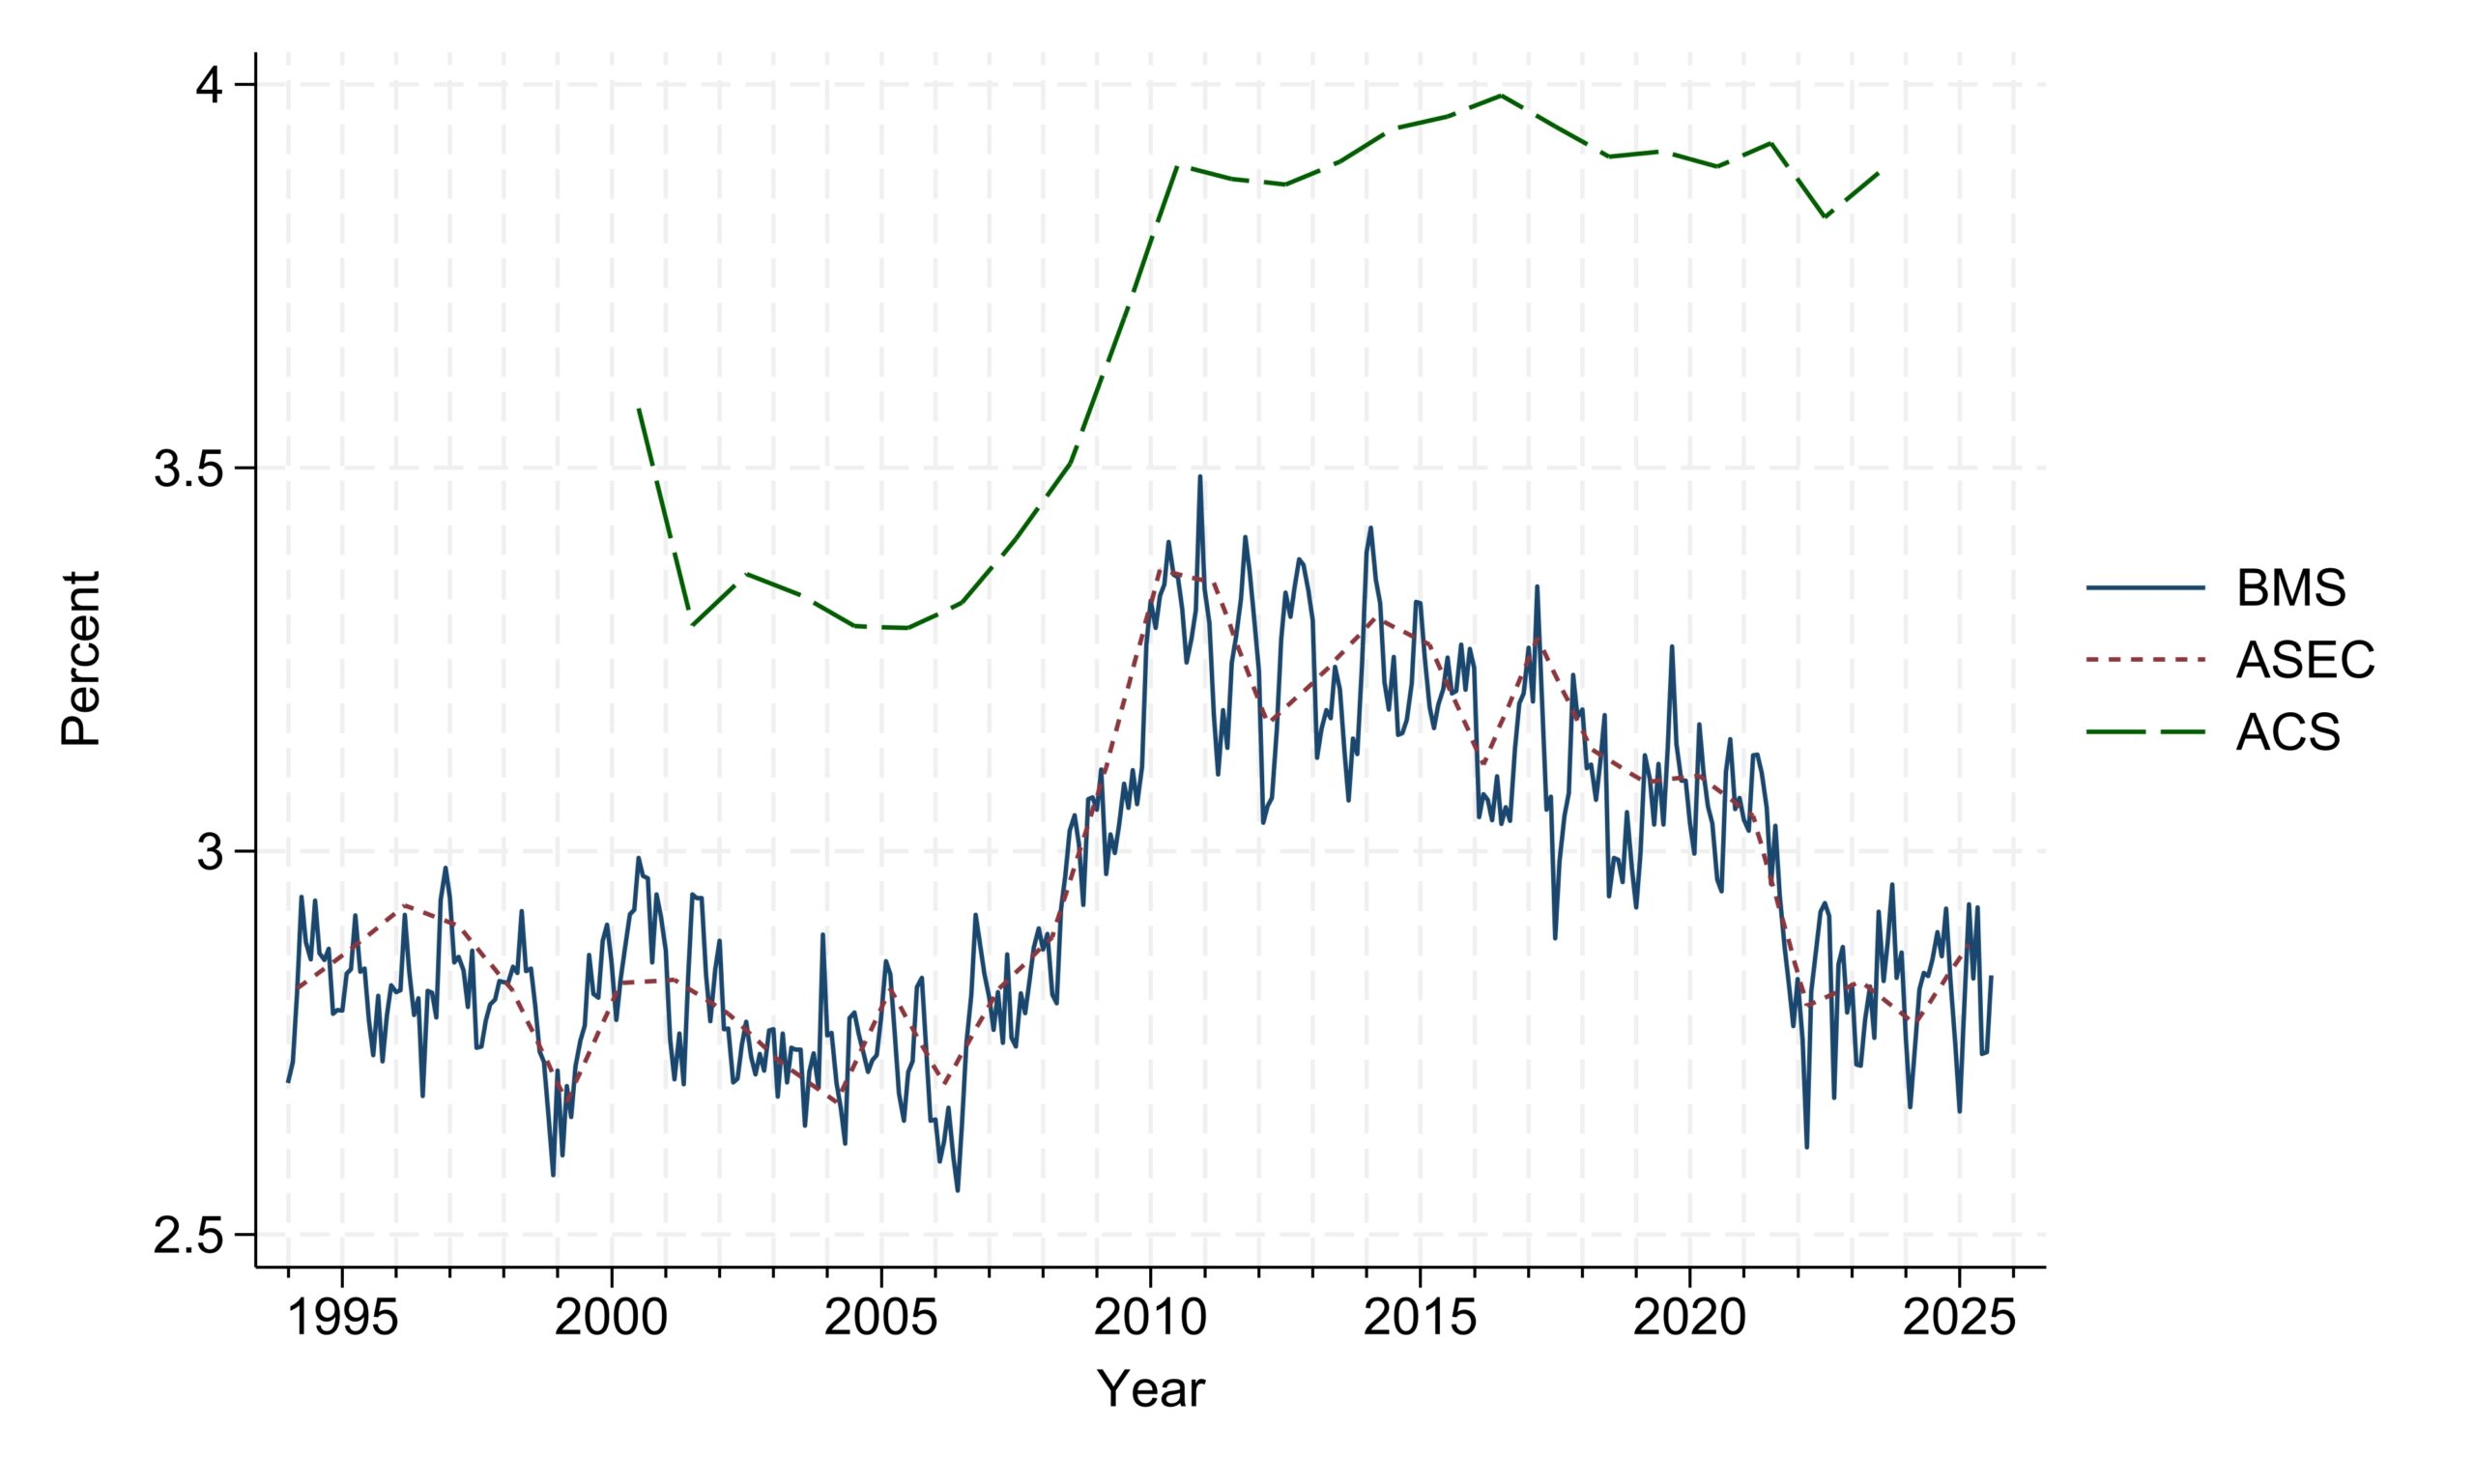
However, Figure 2 and especially Figure 3 highlight significant differences between the ACS and the CPS estimates of multigenerational households. First, ACS data show a systematically lower proportion of two-generation households and a systematically higher proportion of 3+ generation households than CPS data. Second, in addition to these differences in levels, we also detect differences in trends. While both ACS and CPS data show increases in the proportion of 3+ generation households between 2005 and 2010, ACS data shows a relatively stable prevalence of these households after 2010 whereas CPS data shows a progressive decline in the prevalence of these households since 2010.
Figure 3 – Percent of 3+ Generation Households in Major US Population Surveys, 1994-2025
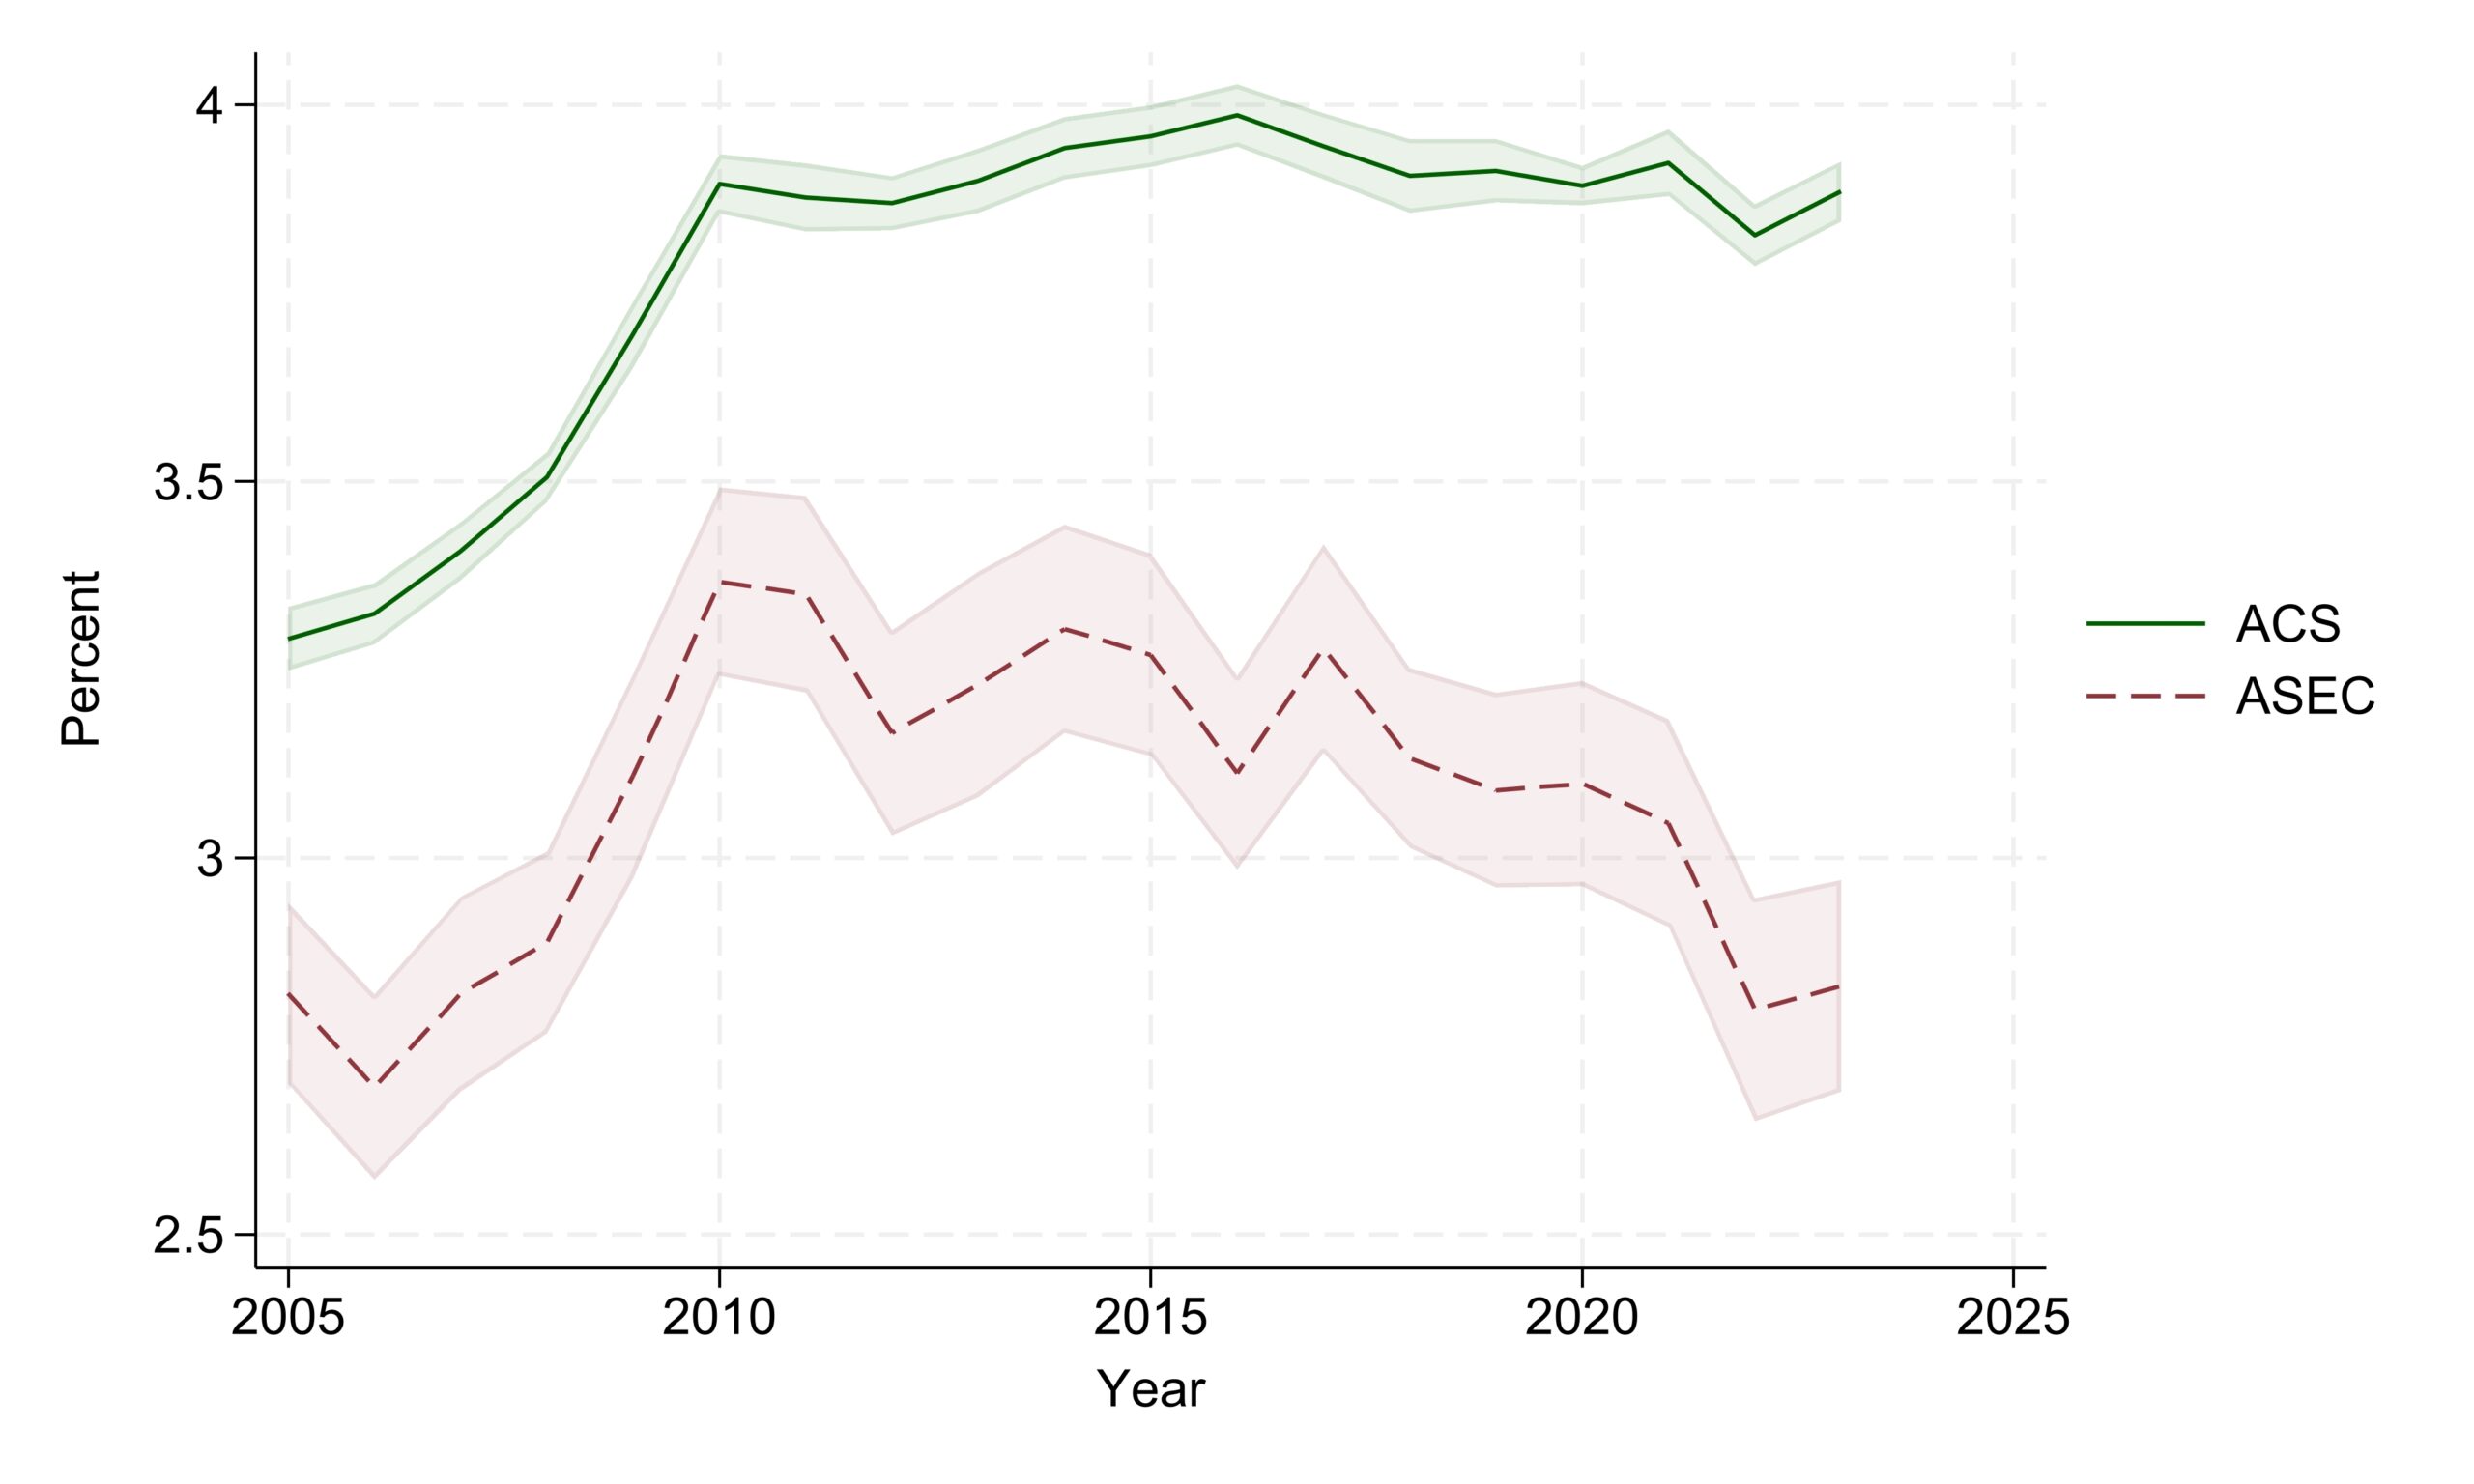
These diverging trends deserve further scrutiny. They are not due to sampling error, as can be seen on Figure 4 which compares ACS and ASEC estimates of 3+ generation households between 2005 and 2023 with 95% confidence intervals. (This choice of surveys and time period was dictated by the limited availability of household-level replicate weights, which offer the best estimate of standard errors for publicly available data. However, while we omitted BMS samples from Figure 4 because they do not have replicate weights, our estimates using other survey methods convey exactly the same story as that seen when comparing the ASEC and ACS.)
Figure 4 – Percent of 3+ Generation Households in the ASEC and ACS, 2005-2023
A notable difference between the data collections is the level of detail in the RELATE variable. In particular, the ACS provides information on in-laws whereas CPS does not. However, MULTGEN already captures in-laws’ generation(s) when there is a linking spouse in the household (they are identified using SPLOC, MOMLOC and POPLOC). Moreover, we find only an exceedingly small proportion of two-generation households only composed of in-laws without linking spouses in IPUMS USA (see MULTGEN’s case count view for detailed code “24 – 2 adjacent generations, in-law(s) without linking spouse”). In other words, these specific differences in RELATE can only explain a very small portion of the discrepancies in multigenerational households between the ACS and CPS – and only in regards to levels, not trends in multigenerational households.
What else could explain the discrepancies highlighted above? It may be that sampling frame differences between the ACS and CPS play an important role which cannot be fully explained away by using replicate weights. The ACS and CPS also use slightly different definitions of what is a household member for drawing their household roster (Amorim et al. 2023): household members in the CPS include only people who “usually” live in the household, whereas the ACS includes anyone who has lived in the household for two or more months, or for less than two months but has nowhere else to stay. Yet, can these hypotheses explain differences in both levels and trends of multigenerational households between major US population surveys? These questions remain open.
All of this reveals that technical considerations on how to measure household membership may be at the heart of more substantive considerations on the causes and consequences of multigenerational households. Researchers should keep these constraints – and opportunities – in mind when using MULTGEN.