By David Van Riper, ISRDI Director of Spatial Analysis
What’s new?
We just released updated land cover summaries for census tracts, county subdivisions, counties and places. Our land cover summaries describe the proportion of a particular geographic unit (e.g., a county or a census tract) that is covered by a particular land cover class (e.g., deciduous forest, evergreen forest, or cultivated crops). This release provides users with land cover summaries from nine vintages of the National Land Cover Database (NLCD) – 2001, 2004, 2006, 2008, 2011, 2013, 2016, 2019, and 2021. Summaries are available for 2010, 2020, and 2022 census tract, county subdivisions, counties, and places. We include 2022 versions of these geographic units because that was the year the Census Bureau began identifying planning regions in Connecticut. These regions replaced Connecticut’s historical counties, which have long had no official administrative function. These new planning regions changed the unique identifiers for census tracts, county subdivisions, and counties.
Why did IPUMS NHGIS create these land cover summaries?
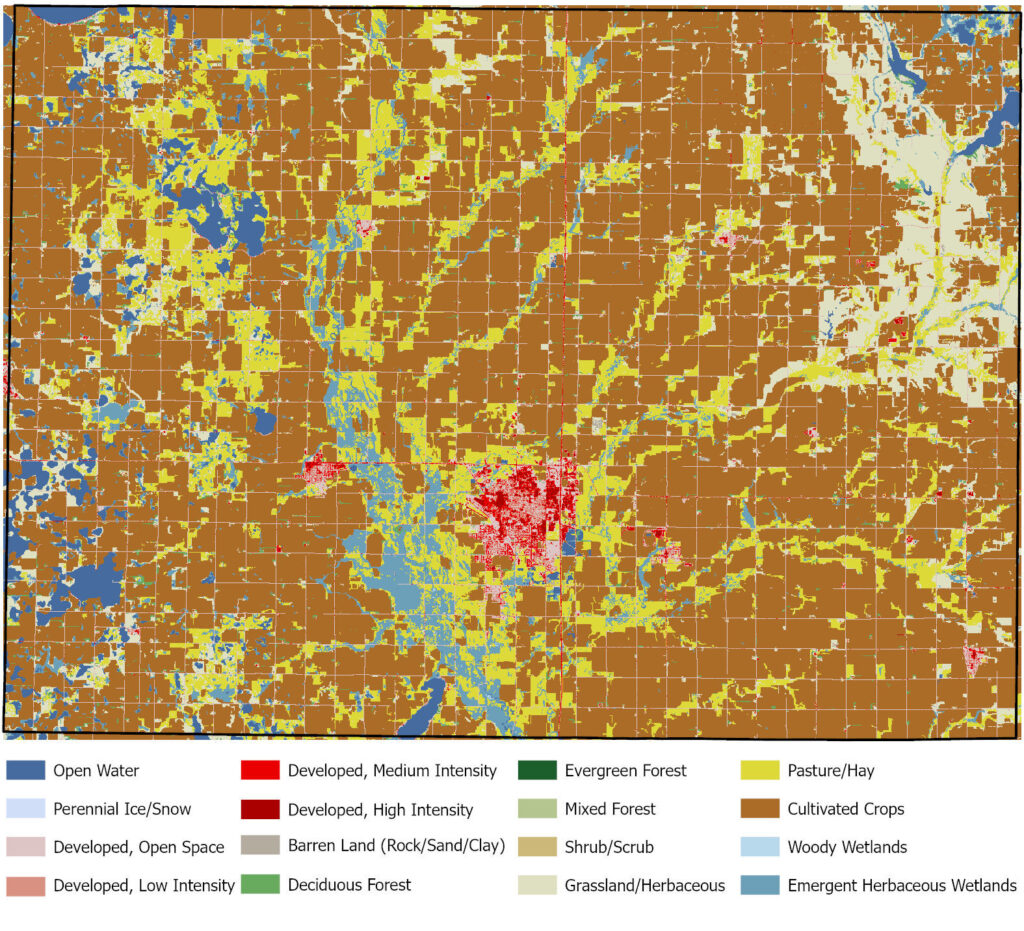
Land cover data is commonly used to study the impacts of natural events such as hurricanes or human modifications such as converting forest to agriculture or agricultural land to developed land. Land cover data is typically released as a high spatial resolution, gridded spatial dataset where each grid cell (or pixel) is assigned to a land cover category (Figure 1, Panel A). The gridded data almost never align with the geographic units, and the high spatial resolution yields massive files that can be slow to process. A single NLCD file is 25 gigabytes in size.
We summarized nine versions of the NLCD to multiple sets of geographic units so that users can easily integrate the data into analyses already structured around geographic units. This reduces the burden on individual users to create such summaries themselves.
How did we compute the summaries?
We used RStudio Server 2023.12.0 and R version 4.3.2 along with the exactextractr, ipumsr, here, zip, and tidyverse packages to generate the land cover summaries. We began by manually downloading and unzipping the NLCD Land Cover (CONUS) All Years files from the Multi-Resolution Land Characteristics Consortium Data Download page.
We then wrote an R script that (1) downloaded IPUMS NHGIS shapefiles for census tracts, county subdivisions, counties, and places using ipumsr; (2) loaded a shapefile into an sf object; (3) computed the proportion of the shapefiles’s units covered by the land cover categories in an NLCD file; (4) repeated step (3) for each NLCD file; and (5) wrote the summaries to a CSV file. We then repeat steps (1)-(5) for each shapefile.
Figure 1 provides a visual representation of our land cover summarization process. Panel A depicts the 2019 NLCD data for Brookings County, South Dakota. We can see the various types of land cover in the county, but it is difficult to determine what proportion of the county’s area is covered by each class. Panel B shows those proportions. Cultivated Crops covered 62% of Brookings County in 2019, and Pasture/Hay covered 14%. While we do observe developed land cover in the county, those classes only covered 6% of the county’s land.
Panel A.
Panel B.
| Land cover category | Proportion covered by each category |
|---|---|
| Open Water | 0.03 |
| Perennial Ice/Snow | 0.00 |
| Developed, Open Space | 0.04 |
| Developed, Low Intensity | 0.01 |
| Developed, Medium Intensity | 0.01 |
| Developed, High Intensity | 0.00 |
| Barren Land (Rock/Sand/Clay) | 0.00 |
| Deciduous Forest | 0.01 |
| Evergreen Forest | 0.00 |
| Mixed Forest | 0.00 |
| Shrub/Scrub | 0.00 |
| Grassland/Herbaceous | 0.09 |
| Pasture/Hay | 0.14 |
| Cultivated Crops | 0.62 |
| Woody Wetlands | 0.00 |
| Emergent Herbaceous Wetlands | 0.05 |
How to download the data?
We provide two ways of downloading these new land cover summary data. You may download ZIP files directory from the IPUMS NHGIS Environmental Summaries website, or you may use the IPUMS API endpoints for supplemental files.
Who did the work?
The data processing pipeline was developed by Prayash Pathak and Saemi Lee, Summer 2024 ISRDI Diversity Fellows, with support from Kate Vavra-Musser (Postdoctoral Fellow), Professor Steve Manson, and myself. The ISRDI Diversity Fellowship program recruits underrepresented undergraduate and graduate students to work on IPUMS data infrastructure projects in collaboration with faculty and research scientists.

