By Anna Bolgrien
IPUMS MICS offers hundreds of harmonized variables related to children’s health and wellbeing that allow for rich and innovative research. From the IPUMS MICS website, users can browse variables and create custom data extracts within a selected unit of analysis. In order to conduct many analyses, however, users will want to combine and link datasets relating to different units of analysis available in MICS.
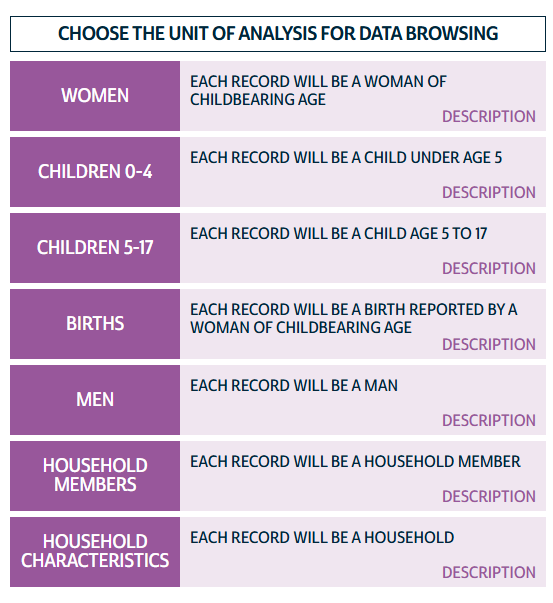
For example, to investigate how child characteristics are related to characteristics of their mother, users will need to download and link data between the Children (either 0-4 or 5-17) unit of analysis and the Women unit of analysis.
IPUMS MICS provides instructions for linking across units of analysis as a user note. This user note lists the variables available as linking keys for each unit of analysis, and is a general guide for linking across the units, such as linking household characteristics with individual person records.
In this blog post, we provide more detailed information on how to link children and adolescents to their mothers. Similar logic can be applied to link children to fathers or other caregivers in the household. As IPUMS MICS requires Stata to conduct harmonization, we provide example code in Stata syntax.