By Matthew Sobek
IPUMS is pleased to announce a major usability upgrade to our online analysis tool: the ability to download tabular output as a CSV file. No more cleaning up html!
The IPUMS online analysis tool has been a big hit with our users, and we’ve made it available for most of the IPUMS data collections. If you haven’t tried it, you should. We even have a tutorial.
Despite its popularity with users, the SDA (Survey Documentation and Analysis) software that drives the system has always had a significant limitation: it produces tables in html format, which is fine for web display but highly inconvenient for cutting and pasting into documents.
In spring 2020 the SDA folks at the Institute for Scientific Analysis were looking for a new project and thoughtfully asked what change we thought users would most appreciate. We responded immediately “CSV downloads,” and within a few months, they had produced a working version of the software that incorporates the new feature. We have now upgraded all the IPUMS sites that offer online analysis to the new version of SDA.
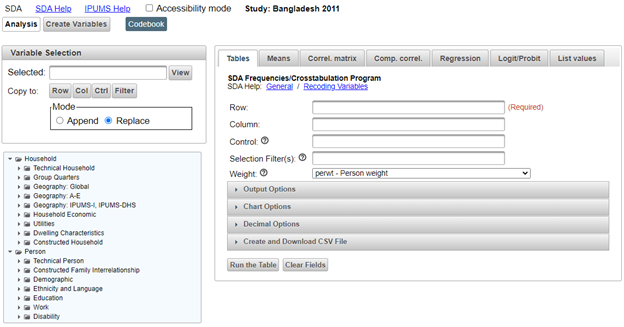
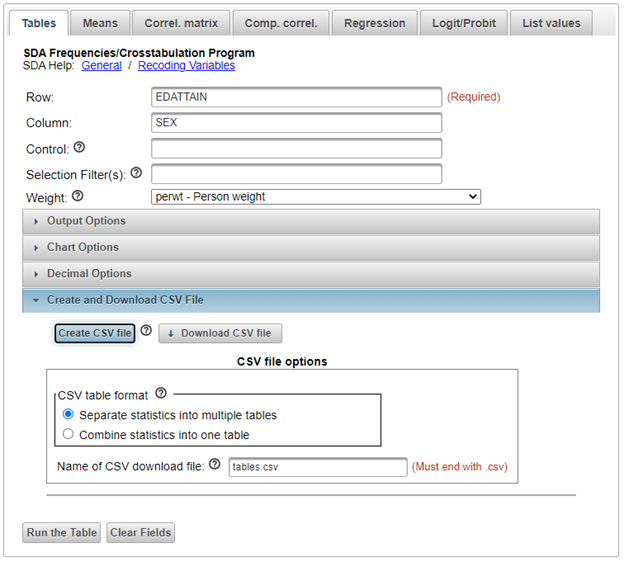
So how does it work? Here’s an image of the initial screen for the 1991 Bangladesh census in IPUMS International. If you’re familiar with the previous versions of SDA you might note that there’s an extra option available in the workspace area to “Create and Download CSV File.”
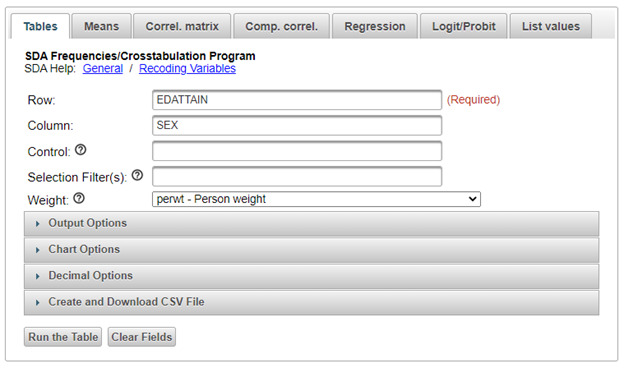
The workflow is familiar to users of older versions of the software. First you define your table: in the example below, educational attainment by sex.
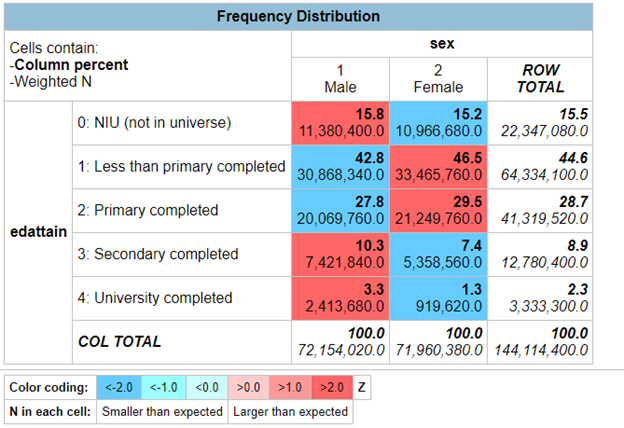
We click “Run the Table” and get the familiar default output, color-coded for expected values.
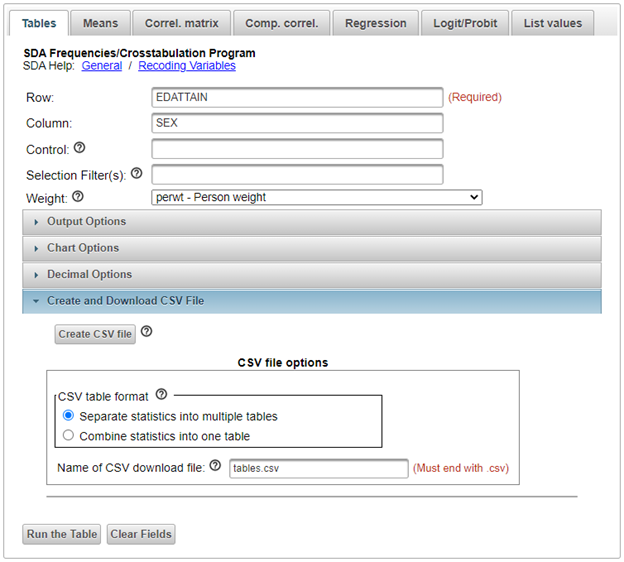
That looks like what we want, so we go back to the control screen and open the panel to “Create and Download CSV File.” We’re presented with the option to lay out the results as multiple tables or one table that will interleave the rows for number of cases and percentages. The default for multiple tables is best for our purposes, so we hit “Create CSV File”.
Now the button appears to “Download CSV file,” which we click.
Once we get the file on our desktop, we open the CSV in Excel. Everything is nicely organized into rows and columns, perfect for cutting and pasting into other documents or for graphing within Excel. All the parameters we entered for generating the table are included in the top rows of the CSV file.
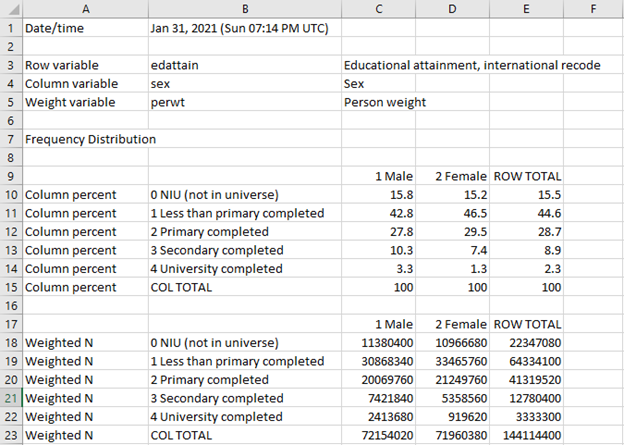
We offered advice to the SDA development team on the layout of these files, so if you don’t like it, blame us. The download feature is available for both the Tables and the Means functions.
We hope IPUMS users will value this feature as much as we do and, as always, use it for good.
