By Miriam King, Senior Research Scientist
 In October 2023, the World Health Organization stated, “3.6 billion people already live in areas highly susceptible to climate change. Between 2030 and 2050, climate change is expected to cause approximately 250,000 additional deaths per year, from undernutrition, malaria, diarrhea and heat stress alone.”
The Demographic and Health Surveys (DHS) are an ideal source for research on the health effects of climate change. Since the 1980s, the DHS has collected a broad range of nationally representative health data from over 90 countries. With supplemental funding from NICHD, harmonized DHS data from IPUMS (dhs.ipums.org) is now doing more to support research on the effects of climate change on health. We are adding new contextual variables; we are integrating data from Malaria Indicator Surveys (MIS); and we are offering guidance through the new Climate Change and Health Research Hub.
Sound research on climate change and health requires combining social science and health data with natural science data. While social scientists and public health researchers have considerable experience analyzing health survey data, few have been trained in simultaneously employing data on environmental factors. This knowledge gap is addressed by the Climate Change and Health Research Hub, under the leadership of Dr. Kathryn Grace and Senior Data Analyst Finn Roberts.
Topics addressed on the Climate Change and Health Research Hub to date include:
- The theoretical foundations of effective research on climate change and health
- Factors to consider when obtaining and preparing precipitation data for use with DHS data
- Step-by-step guidance on attaching remotely sensed CHIRPS data on precipitation to IPUMS DHS data
- A demonstration of how and why integrated geography variables are included in IPUMS DHS
- Techniques for creating monthly temperature metrics for use in longitudinal research
Other posts offer an introduction to R programming and on obtaining data from IPUMS DHS.
Future posts will address vegetation and urbanization.
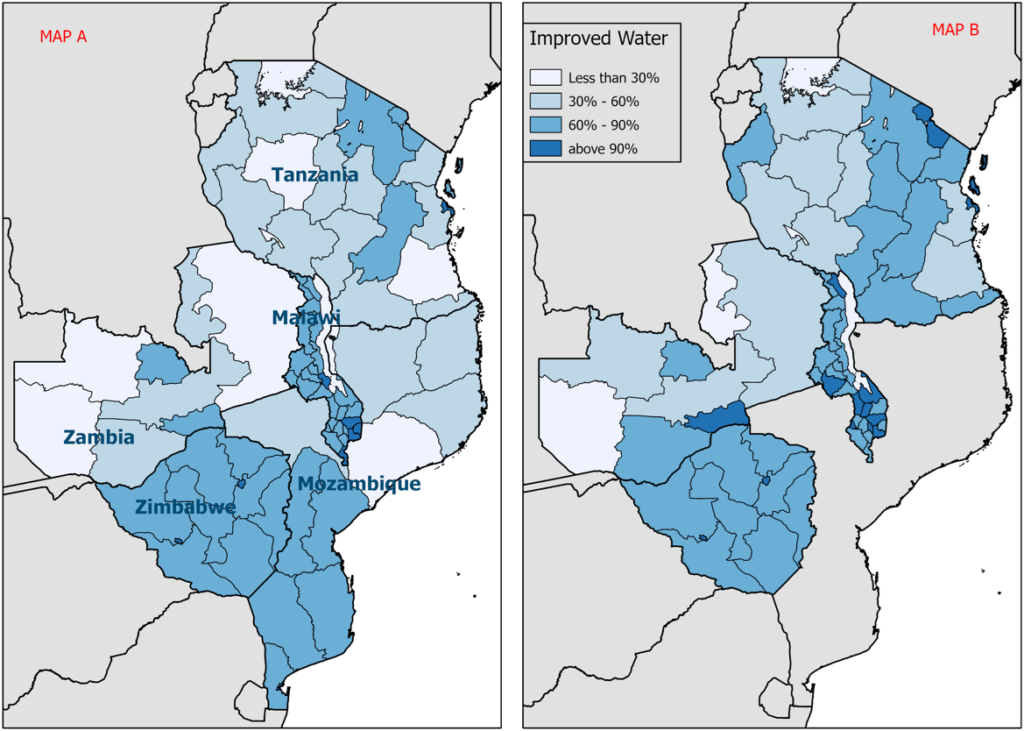
Change in Percent of Households that Use Improved Sources of Drinking Water

