
A Q&A about the new tool
By Daniel Backman, Senior Data Analyst, IPUMS
Earlier this year, the IPUMS Time Use team enabled analysis of American Time Use Survey (ATUS) data via an online data analysis tool. The Survey Documentation and Analysis (SDA) program was developed at UC Berkeley and allows users to analyze data online without a statistical package.
What data are available for analysis?
All years of ATUS data are available for online analysis. Users can choose to analyze a single year of ATUS data, or select among a number of multiple-year data files. Data from specific modules are also pooled together to facilitate analysis of ATUS module data and appropriate weights are set as defaults.
If you are familiar with ATUS data, it is important to note that the data in SDA are not in a hierarchical (or time sequence) format. As such, you are not able to create your own time use variables that summarize time use within a person through the SDA tool. However, a number of pre-fabricated time use variables are available (BLS and IPUMS summary variables as well as the ERS Eating and Health module time use variables).
What types of analyses are possible?
The SDA tool allows for both simple and complex data analysis. Researchers can easily generate frequencies or cross tabulations as well as weighted average time use. You can also perform correlations or estimate regression models (i.e., linear, logit and probit). If you wanted to you could even list values of individual cases.
What should I know before using the SDA analysis tool?
We recommend that users watch this SDA Tutorial video. While it was made for IPUMS USA, it is a nice introduction to analyzing IPUMS data using the SDA tool. Additionally, we encourage you to review the detailed SDA help guide. These tools will give you sufficient background and technical detail to get started.
How do I use the SDA analysis tool?
To access SDA, select the dataset that you wish to analyze from the dataset table on IPUMS ATUS (accessed by clicking the “Analyze Data Online” button on the middle of the homepage). Clicking on a dataset will launch the SDA analysis tool preloaded with that dataset.
From the main SDA analysis page, you can select the type of analysis you would like to perform; the fields you can populate (e.g., row or column) will change depending on the type of analysis you select. You can drag and drop variables into these fields from the variable menu on the left, or just type them in directly. There are many ways to customize how your results are presented using the output, chart, decimal options dropdown menus. Click on “Run the Table” to run your analysis; your results will open in a new browser tab.
Note that most SDA features have an associated help page. Select the (?) icon next to a feature to open help text with more information and examples.
What about an example?
Sure!
Excitingly, there has been a baby boom among IPUMS staff in recent years! And working for a research institute with data at our fingertips is a great opportunity to look at how having children is associated with the time people spend at work, at home, or asleep.
We can use the SDA tool to generate weighted means comparing how much time men and women spend on household activities in general, and then comparing time in household activities for men and women with a child under the age of one in the household. This is merely for descriptive, explanatory purposes and to showcase SDA. There are more sophisticated analyses that can be undertaken on this topic using the SDA tool, but we will leave those for another day.
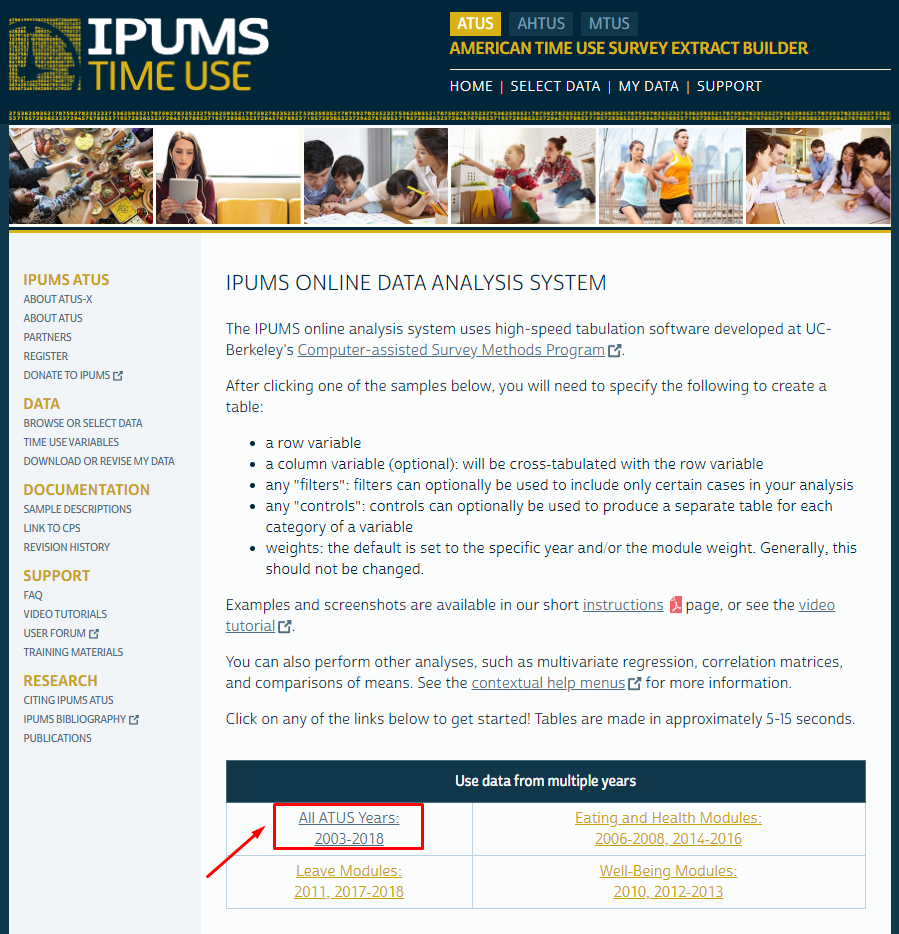
First, click on “All ATUS Years 2003-2018.”
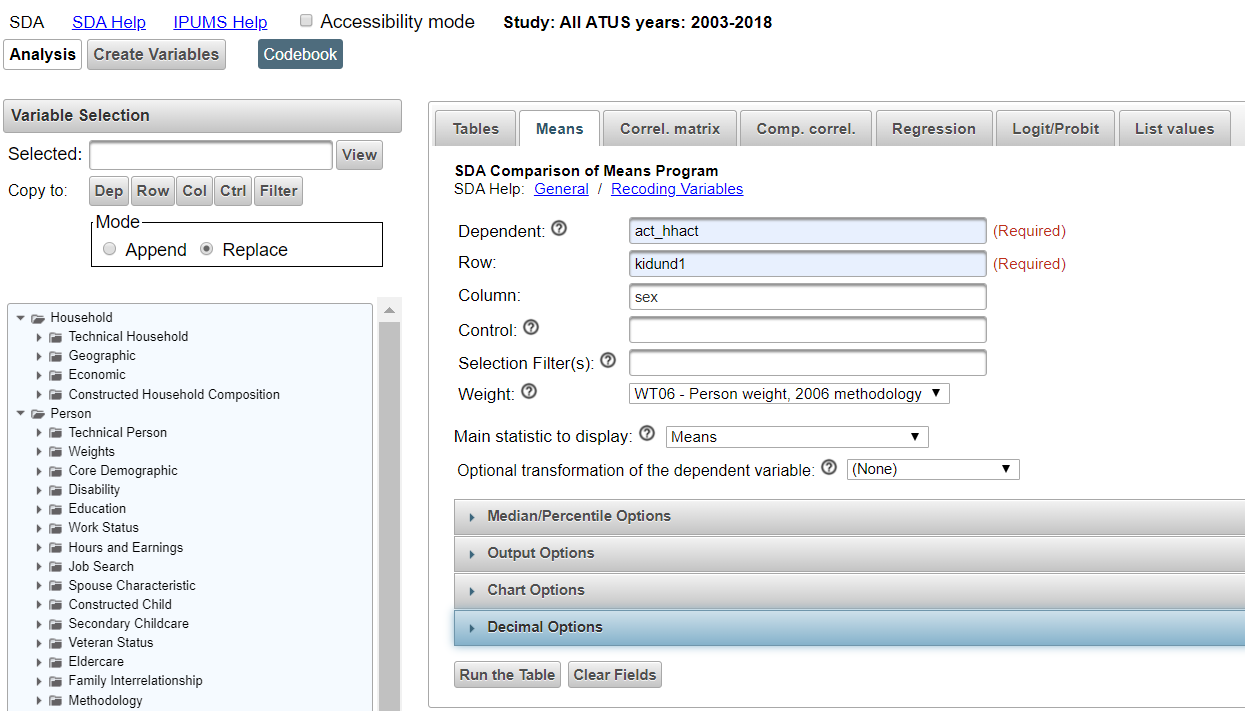
Let’s select ACT_HHACT as the dependent variable. ACT_HHACT reports the minutes each respondent spends in housework, yardwork, and home maintenance. You can drag the variable over from the left-hand menu into the dependent variable field, or you can type the variable name directly into the field. You can right-click on the variable in the left-hand menu to view more information about it; additionally, IPUMS variable descriptions are linked in the SDA codebook. Enter “kidund1” in the row field, and “sex” in the column field. Let’s run the table!
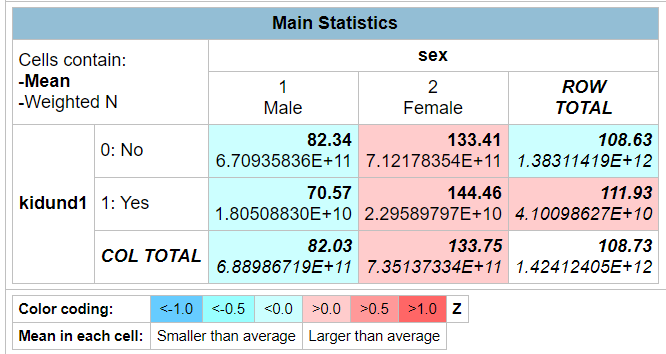
Standard output for the comparison of means analysis reports the mean, standard deviation, and weighted N on a per cell basis, as well as totals for each row and column and a bar or line chart based on the variables you selected. Note that the weighted N represents days as opposed to individuals.
In this example, we can see that across all men in the pooled 2003-2018 time period, men with a child under one years old in their household spend, on average, 12 fewer minutes on household activities (mean=70.57 minutes daily) than men without a child under the age of one in their household (mean=82.34 minutes). However, the opposite is true for women. Women with a child under the age of one in their house spend (mean=144.46 minutes), on average, 11 minutes more on household activities than women without a child under one years old (mean=133.41 minutes) in their house. Additionally, we can see that regardless of the presence of a child under one in the household, women spend more time on household activities.
Table: Weighted means, time spent on household activities for men and women with and without a child under 1 in their house.
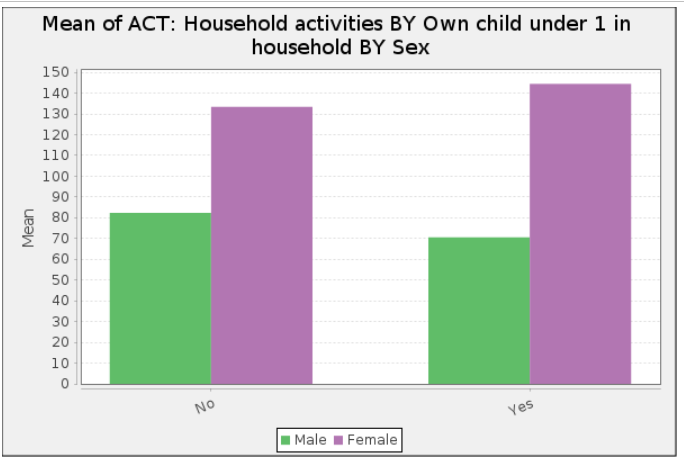
SDA automatically creates bar charts (line chart is also an option) for the variables and analysis submitted. These charts can be formatted on a limited basis in the “Chart Options” menu under the initial analysis selection page. We can see the changes in time use that happens when a child under one is in the house!
We hope you’ll use this new way to explore time use data.
As always – use it for good!