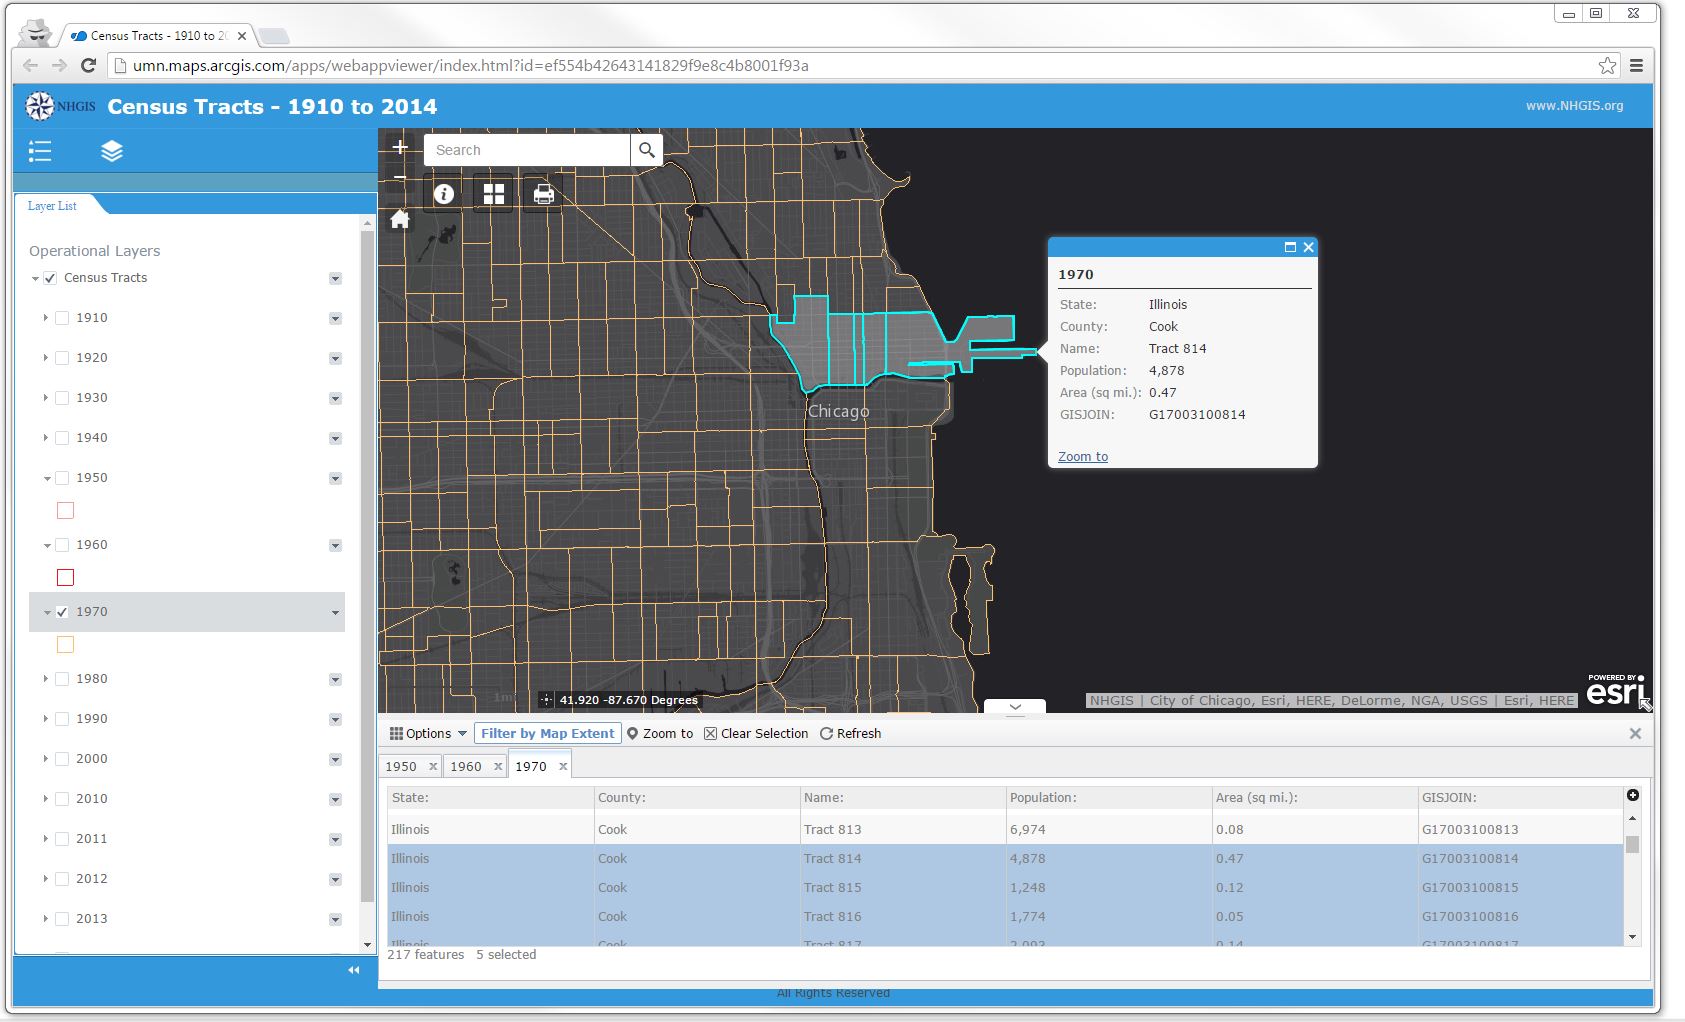
NHGIS recently launched a pair of web maps highlighting the available GIS files and striking changes in boundaries over time for two popular geographic levels. The ‘Census Tract’ map displays data for years 1910 to 2014, and the ‘Place’ map depicts data for 1980 to 2014. With each year listed as a separate layer, users can easily toggle specific years on and off to visualize the data.
“We often hear from NHGIS users who want to understand the historical boundary changes for their study area—often a single neighborhood or perhaps a cluster of counties,” says Spatial Analysis Director David Van Riper. “If you don’t use GIS software, this can be almost impossible. We wanted to give all users, but especially those without access to or familiarity with GIS, the ability to explore this data with ease. Now with these easy to use maps, anyone can zoom into an area and, with a few clicks, get the information they need!”
The web maps tool was created to provide a fast and simple overview of the GIS offerings on NHGIS, and the general comparability of geographic units over time. The web maps are especially helpful in determining which particular census units cover an area of interest.
By using the tract map, a researcher might quickly identify the four tracts that make up the city neighborhood in which they are interested. This simple information, allows researchers to more easily locate the tracts within the demographic data tables (which do not provide that neighborhood information).
Users wishing to download the data, conduct spatial analysis, or visualize a wide range of demographic statistics will be unable to do so through the map; access to the data for download, as always, is free through the NHGIS Data Finder.
NHGIS plans to release additional maps in the future. With over 1,000 GIS boundary files available in the Data Finder, there are plenty of new maps to make. Maps for modern geographic levels, like ‘Voting District’ or ‘PUMA’, might aid researchers interested in a variety of ongoing policy issues. Likewise, the State’ and ‘County’ geographic levels which extend back to the year of the first American census, 1790, might aid users trying to understand the country’s historical expansion.
Both maps were created using the Esri ArcOnline and Web AppBuilder for ArcGIS platforms, with assistance from U-Spatial, which provides support for spatial research at the University of Minnesota.
Contact NHGIS user support with questions or comments at nhgis@umn.edu.
