
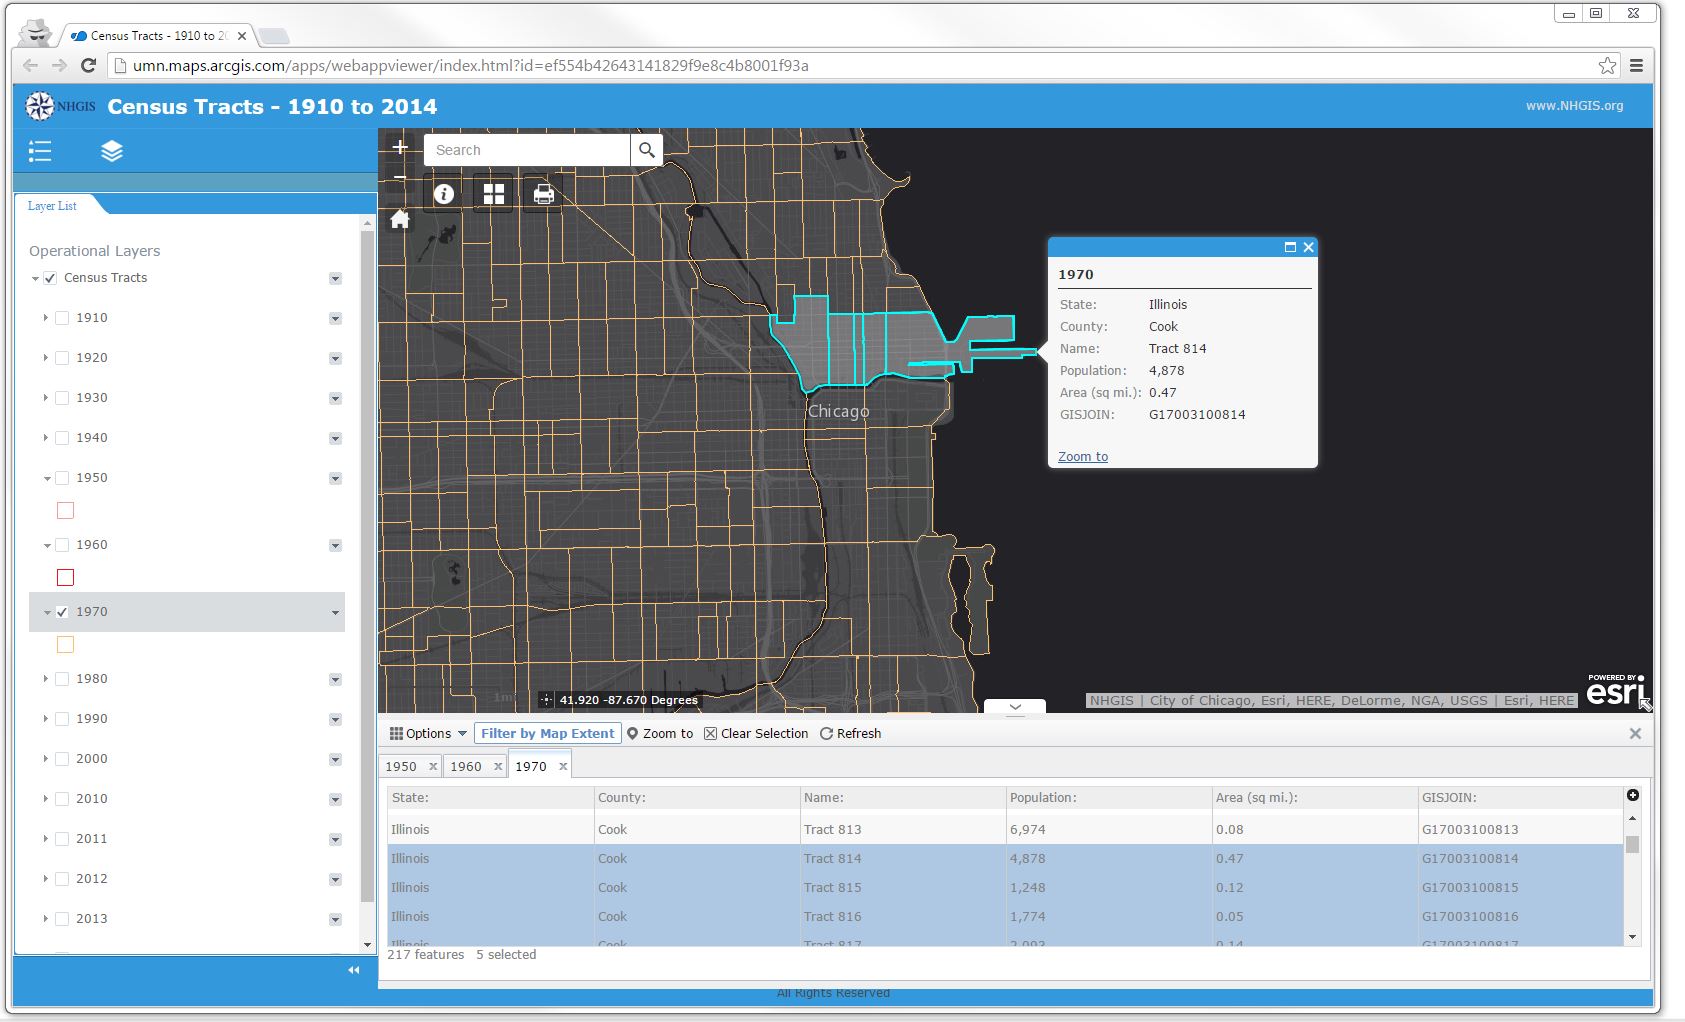
NHGIS recently launched a pair of web maps highlighting the available GIS files and striking changes in boundaries over time for two popular geographic levels. The ‘Census Tract’ map displays data for years 1910 to 2014, and the ‘Place’ map depicts data for 1980 to 2014. With each year listed as a separate layer, users can easily toggle specific years on and off to visualize the data.