
By Tracy Kugler and Tsu Zhu
The problem with OCR and numbers
To extract data tables from census reports only available as print documents, IPUMS IHGIS uses optical character recognition (OCR) software to automate the conversion of scanned images into digital representations of letters and numbers. OCR software has made great strides in accuracy for textual information by using dictionaries of known words to interpret uncertain letters. However, dictionaries do not help in distinguishing uncertain numerical digits. While a dictionary can suggest that the third character in “wh_t” should be an ‘a’ and not an ‘o’, there is no simple way to tell whether the third digit in “45_” should be a 3 or an 8. To ensure that IHGIS data are accurate, we must have confidence that each number has been recognized correctly and matches the number in the source document.
To address this gap, we developed an R package that leverages IHGIS structured metadata to identify logical relationships between cell counts and row/column totals and determine where cells don’t add up as expected. Often, a given cell participates in multiple relationships, which allows the package to use patterns among discrepancies to pinpoint and correct errors. The package can automatically identify and correct up to 95% of error cells, depending on the structure of relationships.
Identifying relationships from structured metadata
The R package currently relies on structured metadata generated by earlier stages in the IHGIS data processing pipeline to identify sum and total relationships among rows and columns. After tables are OCR’ed from source documents, we use a customized markup framework to generate metadata. We then convert the marked up files into CSV files with a standard structure, which serve as input to the quality assurance/quality control (QA/QC) process. The CSV files include hierarchical labels for categories on the columns and geographic units on the rows. Within the labels, blanks are used to indicate totals. The package identifies a column/row with a blank header cell as the sum of other columns/rows that share the same non-blank label(s) and have sub-category labels corresponding to the blank.
Figure 1: Structured metadata with blanks indicating totals
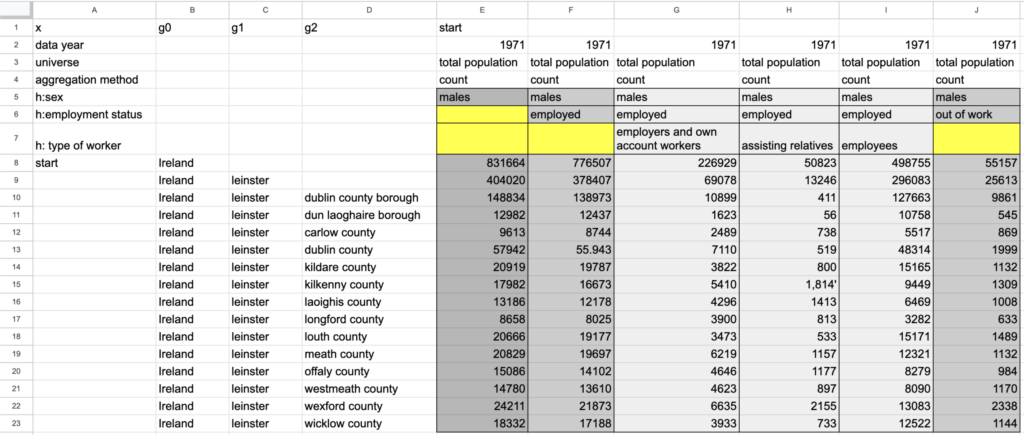
For this post, we will walk through the QA/QC process for a portion of a CSV file from the Ireland 1971 census with categories of employment status for men in the columns and a subset of Ireland’s counties in the rows (Figure 1). Column E, “males,” with blanks on rows 6 and 7, is the sum of columns F and J, “males : employed” and “males : out of work.” Similarly, column F, “males : employed,” is the sum of the type of worker sub-categories in columns G, H, and I. For the rows, Leinster in row 9 is the sum of its child units in rows 10 to 23. For each relationship, the package checks the data values and flags cases where the sums of counts do not match the totals as expected.
Pinpointing errors
The package uses intersecting relationships to pinpoint which cells contain digit recognition errors and infer the correct values for those cells. Knowing that a set of related columns or rows do not add up as expected signals that one or more cells are incorrect. But with information about just one relationship, the error could be in the total cell or any of the cells participating in the sum. Fortunately, most census tables contain multiple relationships, and their intersections can narrow down the locations of errors.
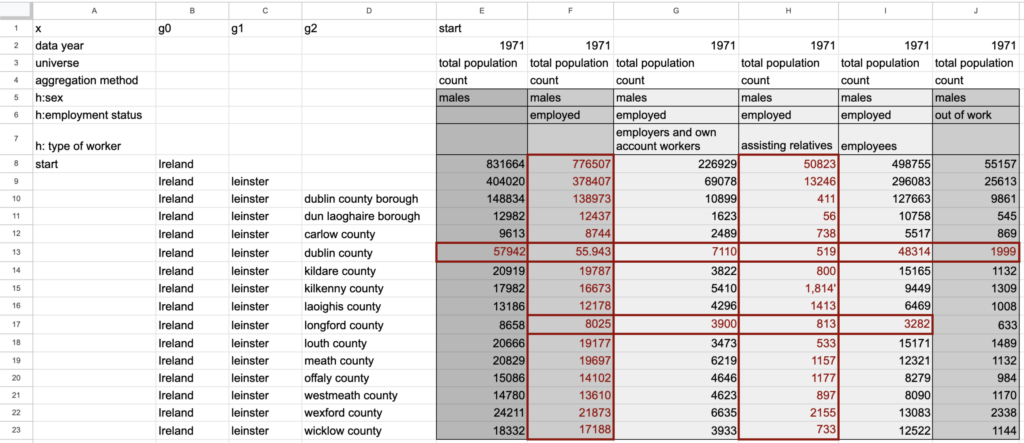
In the example table, the following relationships don’t add up as expected (Figure 2):
- For the relationship Column F = sum(Columns G, H, I), rows 13 (Dublin county) and 17 (Longford county) do not add up.
- For the relationship Column E = Column F + Column J, row 13 (Dublin county) does not add up.
- For the relationship Row 9 = sum(Rows 10 to 23), columns F and H do not add up.
The combination of these incorrect relationships encompasses all the cells highlighted in red in Figure 2.
Figure 2: Cells that participate in incorrect relationships
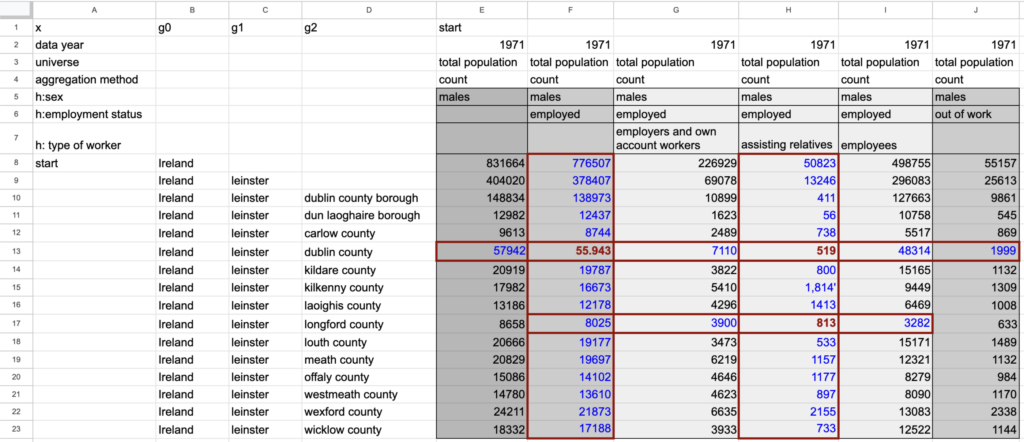
You may have noticed that the sets of cells involved in incorrect relationships overlap, with a few cells being involved in multiple incorrect relationships. The package uses these intersections to narrow in on the cells that are most likely to contain incorrectly recognized values. The set of potential error cells is first reduced by dropping any cells that participate in relationships that are correct, on the assumption that if a cell is wrong, all the relationships it participates in will be incorrect. For example, in column F, all cells except the one on row 13 participate in correct relationships summing employed and out of work (Column E = Column F + Column J) and across the types of worker (Column F = sum(Columns G, H, I)). After dropping cells that participate in correct relationships, we are left with three cells (F13, H13, and H17 – denoted by red, bolded text) that are the likely locations of errors (Figure 3).
Figure 3: Pinpointing cells with incorrectly recognized numbers
Inferring correct values
Once the most likely error cells have been identified, the package attempts to infer the correct values for those cells based on their relationships. In an incorrect relationship, the difference between the calculated sum and given total suggests the amount that would need to be added to or subtracted from an incorrect cell to make the relationship add up as expected. If the differences between the calculated sums and given totals for all of a candidate cell’s relationships suggest the same updated value for the cell, we are confident that the suggested value is correct. For example, cell H17 participates in two relationships (column H and row 17) where the calculated sums do not match the given totals. The differences for both the relationships suggest that the correct value is 843 instead of the recognized 813. Based on this agreement, we are confident that 843 is the correct value, and the R package replaces the incorrectly recognized value with the correct one. After making updates for all cells with consistent difference values, the package again checks the validity of all relationships and conducts another iteration of pinpointing and updating error cells. The iteration continues until all relationships are valid or no remaining error cells have consistent difference values across their relationships. If unresolved errors remain, the package generates an Excel file formatted to highlight remaining errors for human review.
Performance and next steps
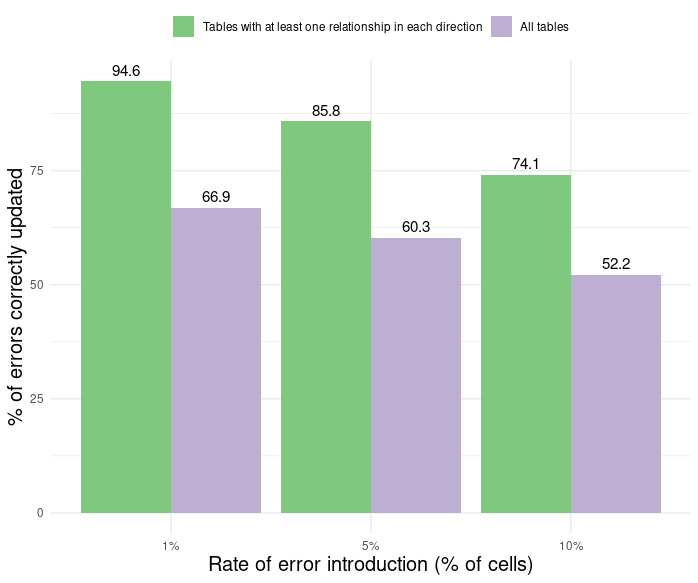
To measure the performance of the automated QA/QC tools, we ran simulations in which errors were randomly introduced into a known percentage of cells for tables with a variety of row/column relationship structures. As expected, the tools performed better on tables with more relationships. Performance was particularly sensitive to the presence or absence of both column and row relationships. In a fairly typical case where tables have at least one column and one row relationship and 1% of cells have errors, the tools were able to automatically identify and correct nearly 95% of errors (Figure 4). Performance drops off as more errors are introduced, but even with 10% of cells having errors, tables with at least one relationship in each direction have a 75% success rate of correctly updating the values. Tables that have been OCR’ed typically have errors in one to five percent of cells, depending on the clarity of the print document and scanned image.
Figure 4: Performance of QA/QC package
We are currently working on extensions to the package that will enable identifying and validating relationships involving percentage values, in addition to the sum relationships for count values described above. Percentage values can be validated when the table includes both the numerator and denominator used to calculate the percentage or when a set of percentage values are expected to sum to 100%.
For more details on the QA/QC package, please see our IPUMS Working Paper.