
By Solvejg Wastvedt and Yash Singh
Disability is dynamic: it evolves over time and interacts with environmental and societal factors. Due to the complex nature of disability, researchers conceptualize and measure disability differently depending on their research question and available data. For instance, an identical condition might evolve differently for a child facing food insecurity compared to one that has stable access to food. Similarly, a physical limitation for a worker in New York City may have a vastly different impact compared to a similar worker in rural Iowa. Disability can be viewed as the relational concept between individuals with physical or mental impairment and the environment.1 2 This complexity makes measuring disability a challenging task. The following post aims to help researchers understand and use disability measurements available in IPUMS data collections.
One way to organize and structure the complex interactions between disability and the environment is by age. Specifically, implications of disability change with age, which leads researchers and data collections to conceptualize disability differently over the life cycle. For children, the focus of disability measures is often tied to age-appropriate developmental markers that help identify and diagnose physical and mental limitations.3 4 5 For working age adults, data often focus on employment or quality of life.6 7 Finally, disability data and research on older adults may focus on mobility challenges and cognitive decline that affect lifestyle and retirement decisions.8 9 In the sections below, we identify and explain a host of variables used to measure disability in various age groups across the IPUMS data collections. This age-based approach to measuring disability provides a general framework to help researchers conceptualize disability over the life course using IPUMS data.
Variables available for multiple age groups
Several disability measures in the IPUMS data collections are available for all age groups. For example, the IPUMS National Health Interview Survey (NHIS) data includes summary measures of limitations such as the variable LANY, which indicates the presence of any of nine activity limitations, and the variable LADL, which indicates limitation in activities of daily living (ADL).
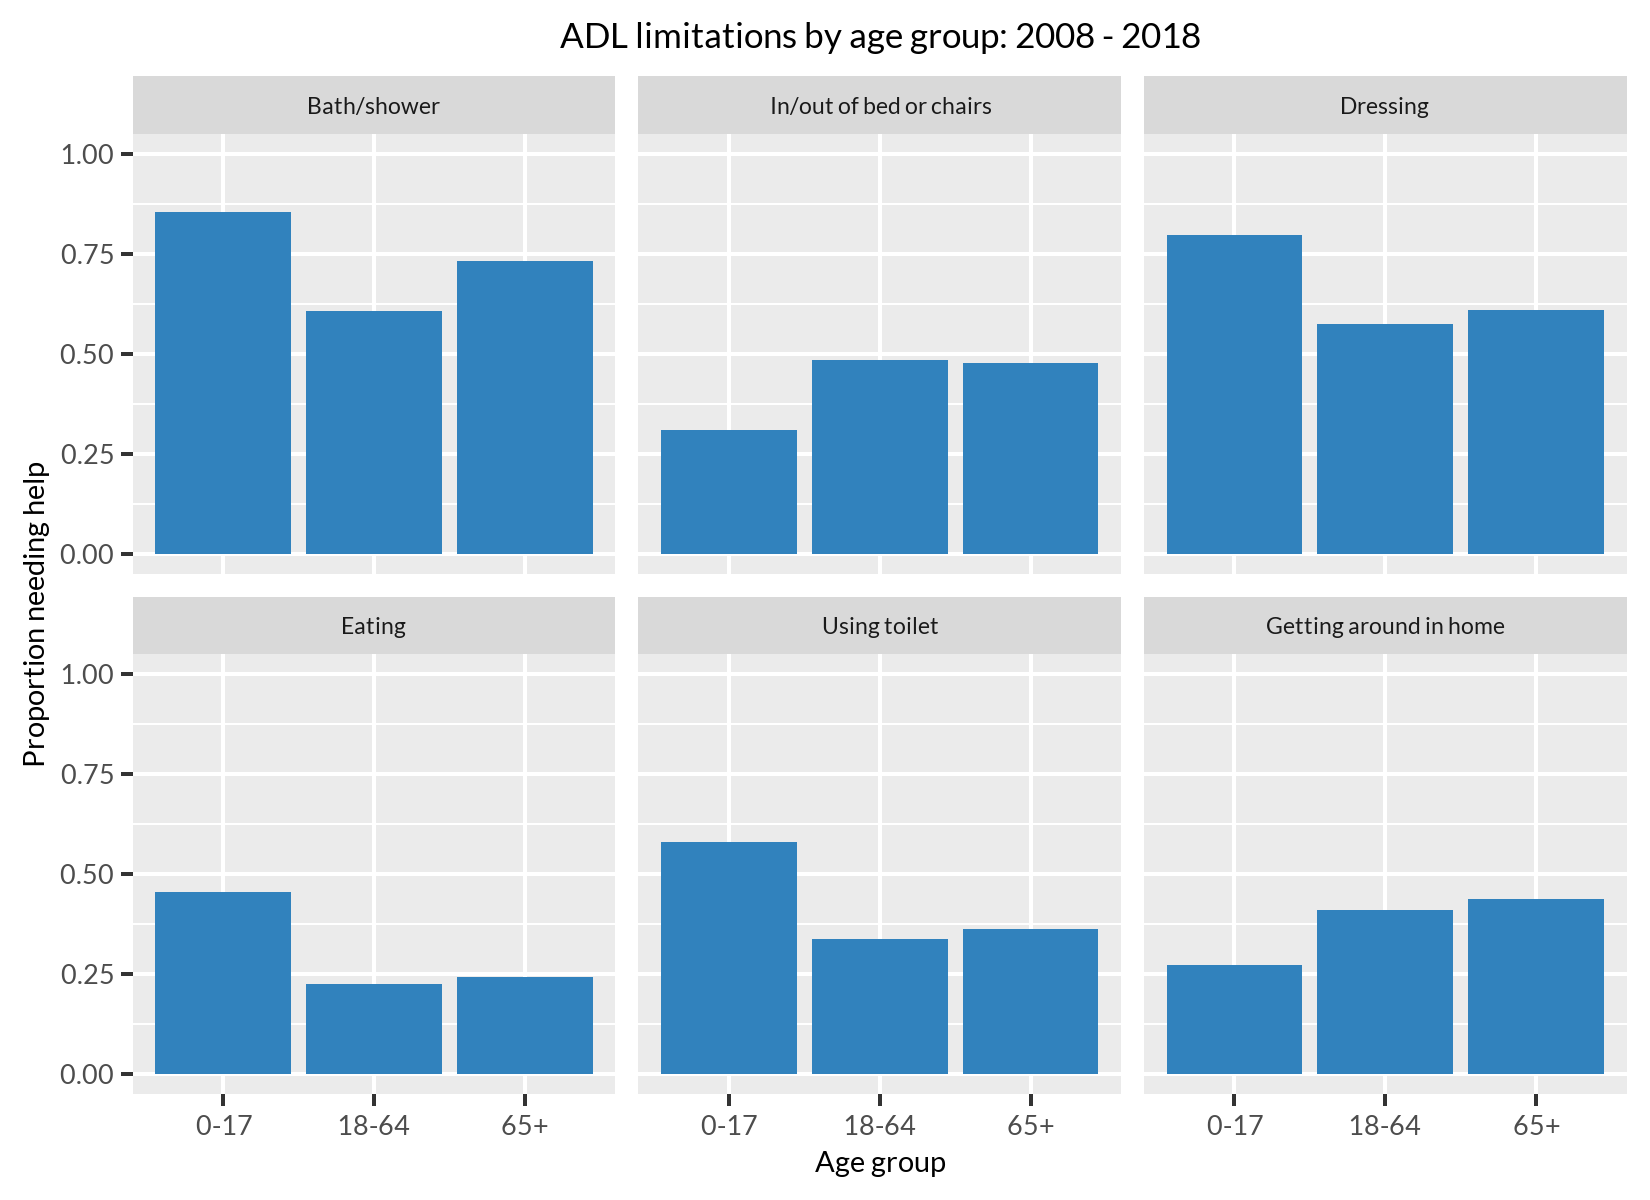
Although these variables are available for all ages, response patterns can vary by age. Consider LADL responses shown in the figure below for 2008 through 2018. Of those with an ADL limitation, more older adults than children or working-age adults need help getting around in the home. Conversely, more children need help using the toilet, dressing, or bathing.
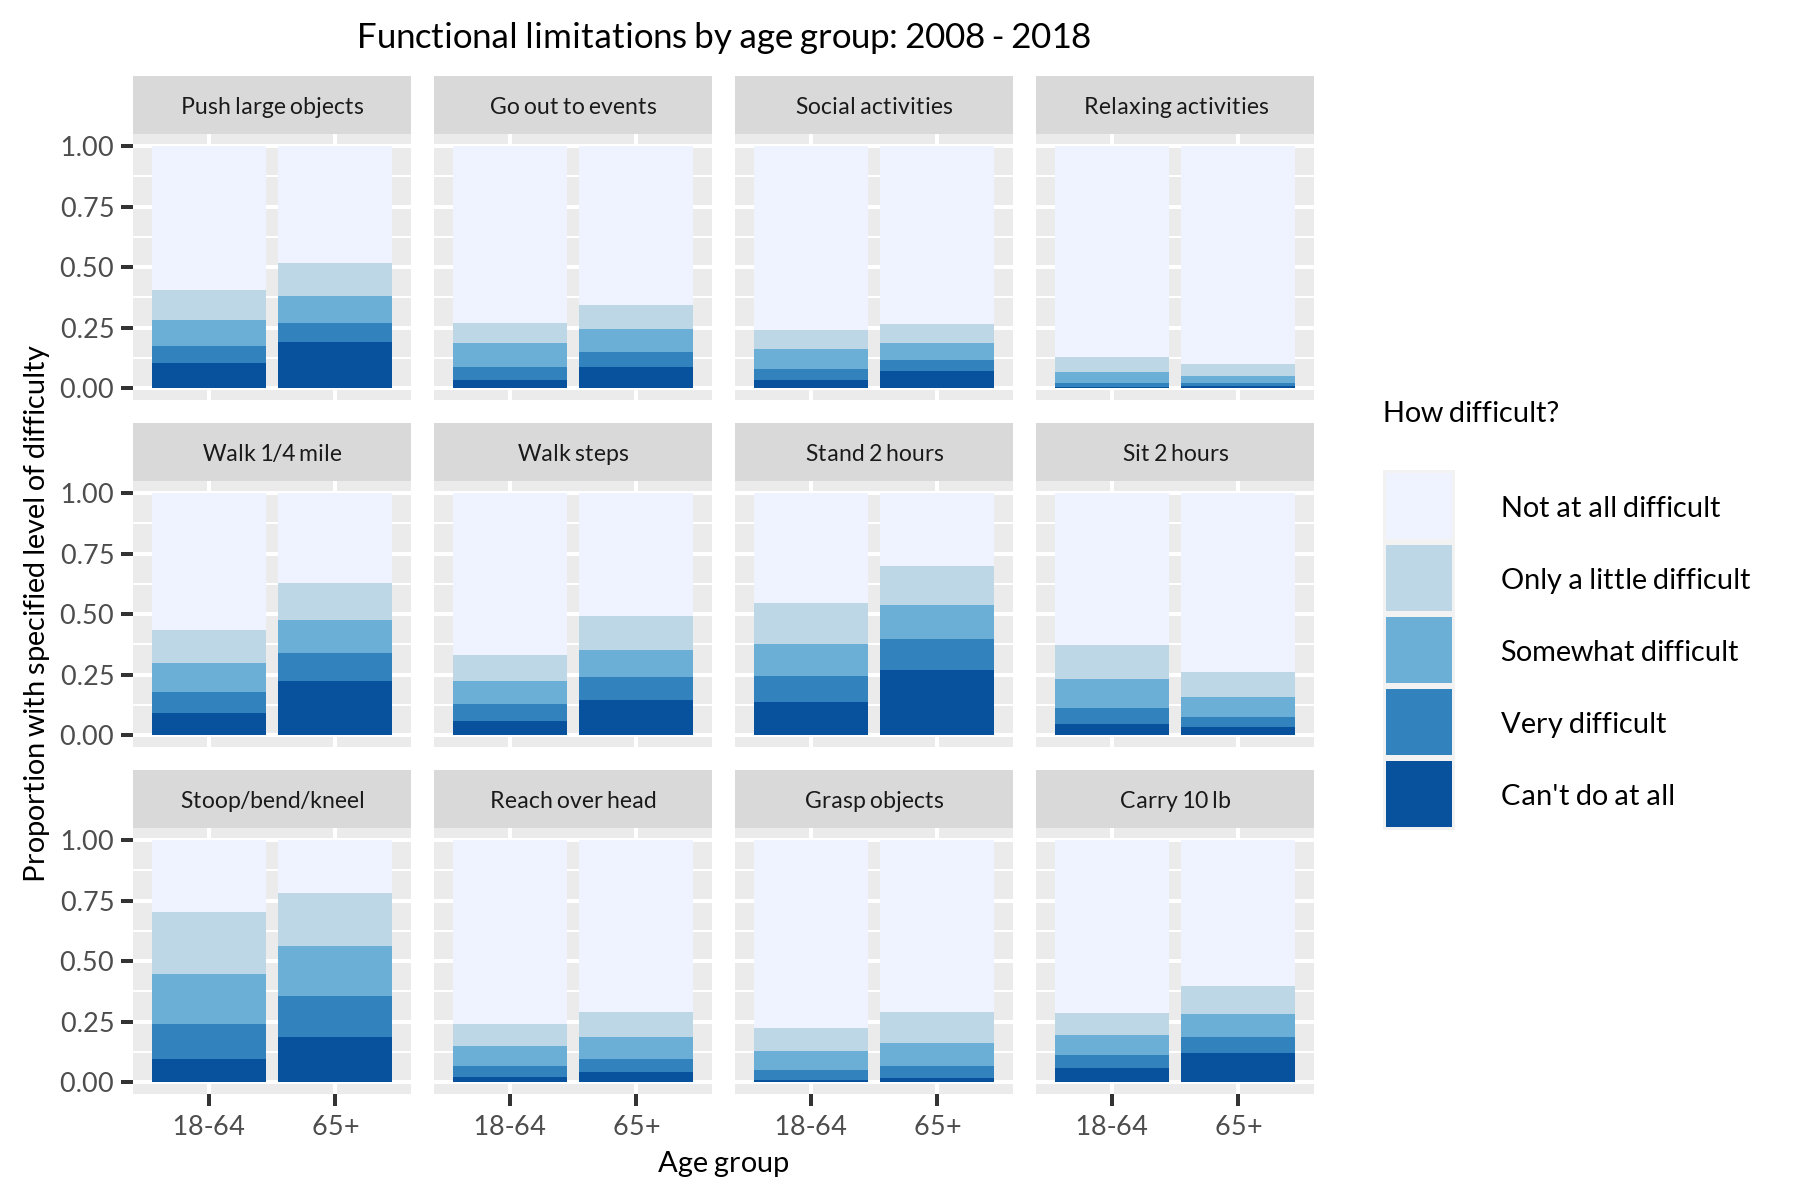
For adults ages 18 and up, NHIS variables FLANY and LAIADL measure functional limitations and difficulty with instrumental activities of daily living (IADLs), respectively. Here, again, differences among age groups are evident, as shown in the figure below.
While the above examples highlight measures from IPUMS NHIS, variables measuring disability at all ages are also available in other IPUMS collections. For example, IPUMS DHS includes measures of relevant limitations for some countries surveyed.10 IPUMS International also includes measures corresponding to guidelines from the Washington Group on Disability Statistics. These variables capture six types of difficulty: hearing, vision, memory, self-care, communication, and mobility.11 The Washington Group standardized measures aim to facilitate comparison across broad geographic coverage and differences in cultural norms around diagnoses and disability.12
For more detail on measures available for all ages in IPUMS USA, NHIS, International, and other collections, see the table at the end of this post.
For the remainder of this post, we focus on disability measures available for specific age groups.
Children
Among the IPUMS data collections, only IPUMS NHIS includes measures specific to children. To capture disability for children, NHIS uses the Child Functioning Module from the Washington Group on Disability Statistics (WG) and UNICEF. Questions focus on age-appropriate developmental markers like vision and hearing, mobility, learning, and play.
Disability measures for children are often focused on identifying and addressing potential limitations at an early age.
For example, the IPUMS NHIS variables IMPMOB and LASPED identify impaired mobility and receipt of special education, respectively, for children under age 18. Two other IPUMS NHIS variables measure development specifically for children under 5: LAPLAYAL (ability to play at all) and LAPLAYAM (limited in kind or amount of play). The figures below show data from these variables for 2018.
Many other disability variables in other IPUMS data collections that are applicable to all ages can also be used in studies involving children. Researchers studying children outside the United States have more limited choices. However, disability measures developed by the Washington Group for all ages are available in IPUMS International and also apply to children. Child health indicators in IPUMS DHS may also be useful.
Working-age adults
Many IPUMS data collections include variables that report physical and mental limitations that may be of interest to researchers studying working-age adults. IPUMS CPS has the unique ability to pair disability measures with detailed employment-related variables collected monthly. These measures help capture the interaction between disability and labor market outcomes. For example, see the labor force participation rates by age group for those who do and do not report serious difficulty walking or climbing stairs (DIFFPHYS).
| 25-34 Years Old | 35-44 Years Old | 45-54 Years Old | 55-64 Years Old |
|
|---|---|---|---|---|
| No physical difficulty | 82.8% | 84.1% | 83.8% | 70.1% |
| Has physical difficulty | 31.6% | 27.2% | 23.6% | 18.5% |
Other IPUMS datasets also include measures that may be of interest for those studying disability and working-age adults. Notably, measures of labor force and/or employment status are also available alongside the disability measures in IPUMS USA, IPUMS NHIS, IPUMS ATUS, IPUMS International, and IPUMS DHS. Many of these datasets also include a work disability measure. There are other variables beyond labor force measures that may be of interest to researchers focused on disability and working-age adults, specifically as they relate to quality of life. For example, IPUMS ATUS provides data on time spent in different activities. This includes work-related activities (ACT_WORK), personal care (ACT_PCARE), and household activities (ACT_HHACT), etc. By pairing disability measures with time use data, researchers may gain insights into the effects of disabilities on people’s daily lives.
Older adults
The data included in the IPUMS collections do not contain disability-related variables exclusive to this age group. However, many of the disability measures found among the all-ages variables listed at the beginning of this post may be relevant to older adults. For example, NHIS data captures extensive detail on health conditions, including conditions applicable to an aging population. Measures of functional limitations, as described in the all-ages section, are relevant to this age group. The variable LAIADL asks about difficulty with “instrumental activities of daily living,” which include household chores and getting around outside the home. NHIS also contains question sets on hearing and vision problems, chronic pain, and use of assistive devices.
As mentioned above, IPUMS International includes Washington Group measures available for all ages. Measures in this set that are particularly relevant for older adults include difficulty with hearing, vision, memory, and self-care. Similarly, IPUMS USA and IPUMS CPS include a broad measure related to IADL limitations; IPUMS USA, IPUMS CPS, and IPUMS DHS include measures of difficulty hearing or seeing. IPUMS ATUS includes measures of time spent in eldercare as well as information on how older adults spend their time.
Conclusion
Disability has different implications for different age groups, so, naturally, different measures are used to capture disability over the life course. While this blog highlights some of the available measures and their relation to age, researchers should also consider external factors that may influence the development and effects of disability. The IPUMS microdata collections contain a multitude of other variables (e.g., income, race, marital status) that further contextualize the environmental and economic conditions that people with disabilities experience . The flexibility of microdata allows researchers to pair age-specific disability measures with other variables to measure endpoints such as health, quality of life, or time use. Ultimately, researchers should select specific disability variables, consider measures that capture environmental factors, and define age intervals based on their unique research questions.
View the IPUMS Disability Worksheet in Google Sheets
Further Reading
These resources document information on disability measurements in the data available through IPUMS that may be of interest to researchers.
Brault, M., Stern, S., & Raglin, D. (2007, January 3). Evaluation report covering disability. U.S. Census Bureau. https://www.census.gov/content/dam/Census/library/working-papers/2007/acs/2007_Brault_01.pdf
Centers for Disease Control and Prevention. (2015, November 6). National Health Interview Survey on Disability. https://www.cdc.gov/nchs/nhis/nhis_disability.htm
Centers for Disease Control and Prevention. (June 2019). 2018 National Health Interview Survey Description. https://ftp.cdc.gov/pub/Health_Statistics/NCHS/Dataset_Documentation/NHIS/2018/srvydesc.pdf.
Survey description documents for other years are available on the CDC website
IPUMS CPS. Disability Supplement Sample Notes. https://cps.ipums.org/cps/di_sample_notes.shtml
IPUMS Health Surveys. User Note – Washington Group on Disability Statistics Measures. https://nhis.ipums.org/nhis/userNotes_washingtongroup.shtml
USAID. (2016, December 2). Collaboration Yields New Disability Questionnaire Module. The DHS Program. https://dhsprogram.com/Who-We-Are/News-Room/Collaboration-yields-new-disability-questionnaire-module.cfm
USAID. DHS Questionnaire Modules. The DHS Program. https://dhsprogram.com/publications/publication-DHSQM-DHS-Questionnaires-and-Manuals.cfm
U.S. Bureau of Labor Statistics. (2015, August 26). Frequently asked questions about disability data. Labor force statistics from the Current Population Survey. https://www.bls.gov/cps/cpsdisability_faq.htm
U.S. Census Bureau. (2021, February 23). How Disability Data are Collected from The American Community Survey. https://www.census.gov/topics/health/disability/guidance/data-collection-acs.html
U.S. Census Bureau. (2017, November 1). How Disability Data are Collected from The Current Population Survey. https://www.census.gov/topics/health/disability/guidance/data-collection-cps.html
Support for this work was provided by the Minnesota Population Center (P2C HD041023) and the Minnesota Population Center Summer Diversity Fellowship Program.
- Pettinicchio, D., & Maroto, M. (2021). Who Counts? Measuring Disability Cross-Nationally in Census Data. Journal of Survey Statistics and Methodology, 9(2), 257–284. https://doi.org/10.1093/jssam/smaa046.
- Altman, B., & Bernstein, A. (2008, July) Disability and health in the United States, 2001–2005. Hyattsville, MD: National Center for Health Statistics. https://www.cdc.gov/nchs/data/misc/disability2001-2005.pdf
- Halfon, N., Houtrow, A., Larson, K., & Newacheck, P. (2012). The Changing Landscape of Disability in Childhood. The Future of Children, 22(1), 13-42. http://www.jstor.org/stable/41475645
- Washington Group on Disability Statistics. (2020, March 19). WG/UNICEF Child Functioning Module (CFM). https://www.washingtongroup-disability.com/question-sets/wgunicef-child-functioning-module-cfm/
- Countries, B. O. C. O. N. S. D. I. D. (2009). Neurological, Psychiatric, and Developmental Disorders: Meeting the Challenge in the Developing World. National Academies Press. https://www.ncbi.nlm.nih.gov/books/NBK223473/
- Drew J. A. (2015, July 1). Disability, Poverty, and Material Hardship since the Passage of the ADA. Disability studies quarterly, 35(3), 4947. https://doi.org/10.18061/dsq.v35i3.4947
- Washington Group on Disability Statistics. (2020, July 9). WG ILO Labor Force Survey Disability Module (LFS-DM). https://www.washingtongroup-disability.com/question-sets/wg-ilo-labor-force-survey-disability-module-lfs-dm/
- Czaja, S.J.,& Moen, P.(2004). Technology for Adaptive Aging. National Academies Press. https://www.ncbi.nlm.nih.gov/books/NBK97338/
- Harada, C.N., Natelson, M.C., & Triebel, K.L. (2013, November). Normal Cognitive Aging. Clin Geriatr Med, 29(4), 737–752. 10.1016/j.cger.2013.07.002
- At least one IPUMS DHS disability measure is available for: Angola, Cameroon, Chad, DR Congo, Egypt, Ghana, India, Malawi, Mali, Morocco, Nigeria, Pakistan, Senegal, South Africa, Uganda, Yemen.
- At least one Washington Group measure is available for: Brazil, Indonesia, Mauritius, Morocco, Myanmar, Senegal, South Africa, Suriname, Tanzania, Trinidad and Tobago, Uganda, Uruguay, Vietnam, Zambia, Zimbabwe.
- Washington Group on Disability Statistics. (2021). About the WG. https://www.washingtongroup-disability.com/about/about-the-wg/