
By Renae Rodgers
As many readers will know, the Current Population Survey (CPS) is a monthly labor force survey that is, among other things, the data source for the monthly jobs report (or more formally the Employment Situation reports) from the Bureau of Labor Statistics.
In this blog post, I will show you how to create a reproducible, sustainable monthly workflow to update previous analyses using new data with IPUMS CPS data, IPUMS Microdata Extract API, and the ipumspy Python library.
If this is not your first CPS rodeo, you may already have a monthly workflow for working with IPUMS CPS data that suits your needs just fine – perhaps written in Stata. Did you know you can use ipumspy to make IPUMS CPS extracts from Stata?! Check out the set up instructions and template .do file in one of our previous blog posts and optimize your monthly analysis even more with the IPUMS Microdata Extract API!
But I digress. In this blog post, I will first walk through a simple analysis using the IPUMS Microdata Extract API and ipumspy. I will then show you how to package that workflow so that it can be simply executed monthly when the most recent data becomes available from IPUMS CPS for refreshed analysis including the newest data.
An example IPUMS CPS, IPUMS Microdata Extract API workflow: teleworking due to COVID-19
Let’s suppose that we’re interested in looking at trends in telework due to COVID-19 over the course of the pandemic. The IPUMS CPS variable COVIDTELEW indicates whether the respondent worked from home at any time during the past 4 weeks due to COVID-19. This example will show us the overall trend in remote work due to COVID-19 as well as how teleworking breaks down by educational attainment. First we’ll define an IPUMS CPS extract that contains COVIDTELEW and EDUC variables and all months from May 2020 to June 2022.
Our first step is to import all of the necessary libraries and modules.
import os
import calendar

import numpy as np
import pandas as pd
import matplotlib.pyplot as plt

from ipumspy import IpumsApiClient, CpsExtract, readers, ddi, utilities
Next, we need to set up a connection to the Microdata Extract API using IpumsApiClient and your API key. In this example, I have saved my API key as an environment variable called “IPUMS MICRODATA_API_KEY” in my conda environment. Saving your API key as an environment variable helps avoid accidentally sharing your key when sharing your code with collaborators, students, or on GitHub. You can find instructions on how to set an environment variable in a conda environment in a previous blog post.
ipums = IpumsApiClient(os.getenv("IPUMS_MICRODATA_API_KEY"))
Now we’ll define an IPUMS CPS extract with our variables and samples of interest. sample IDs can be found on the IPUMS CPS website.
cps_pandemic = CpsExtract(["cps2020_05b", "cps2020_06s", "cps2020_07b", "cps2020_08s", "cps2020_09b", "cps2020_10s",
                          "cps2020_11s", "cps2020_12s", "cps2021_01b", "cps2021_02s", "cps2021_03b", "cps2021_04b",
                          "cps2021_05b", "cps2021_06s", "cps2021_07s", "cps2021_08s", "cps2021_09s", "cps2021_10s",
                          "cps2021_11s", "cps2021_12s", "cps2022_01s", "cps2022_02b", "cps2022_03b", "cps2022_04s",
                          "cps2022_05b", "cps2022_06s"],
                         ["AGE", "SEX", "RACE", "EMPSTAT", "COVIDTELEW", "UH_INDMAJ_B2", "EDUC", "YNGCH"],
                         description="demographic, telework vars - 2020-2022")
Once our extract is defined, we will submit it to the extract system, wait for it to complete, and download the files into our current working directory.
ipums.submit_extract(cps_pandemic)
print(f"{cps_pandemic.collection} extract number {cps_pandemic.extract_id} has been submitted!")
ipums.wait_for_extract(cps_pandemic)
print(f"{cps_pandemic.collection} extract number {cps_pandemic.extract_id} is complete!")
ipums.download_extract(cps_pandemic)
cps extract number 26 has been submitted!
cps extract number 26 is complete!
When that is complete, we can read in the DDI and data files. Side note: When you read in a DDI codebook from an IPUMS extract, you will receive a citation warning – this is just a reminder to Cite us! Seriously though…
filename = f"{cps_pandemic.collection}_{str(cps_pandemic.extract_id).zfill(5)}"
cps_pandemic_ddi = readers.read_ipums_ddi(f"{filename}.xml")
cps_pandemic_df = readers.read_microdata(cps_pandemic_ddi, f"{filename}.dat.gz")
cps_pandemic_df.head()
| YEAR | SERIAL | MONTH | HWTFINL | CPSID | ASECFLAG | PERNUM | WTFINL | CPSIDP | AGE | SEX | RACE | YNGCH | EMPSTAT | EDUC | UH_INDMAJ_B2 | COVIDTELEW | |
|---|---|---|---|---|---|---|---|---|---|---|---|---|---|---|---|---|---|
| 0 | 2020 | 1 | 5 | 1814.8895 | 20200300000400 | NA | 1 | 1814.8895 | 20200300000401 | 72 | 2 | 100 | 99 | 10 | 125 | 10 | 2 |
| 1 | 2020 | 2 | 5 | 3203.8008 | 20200200000500 | NA | 1 | 3203.8008 | 20200200000501 | 21 | 2 | 200 | 1 | 34 | 73 | -1 | 99 |
| 2 | 2020 | 2 | 5 | 3203.8008 | 20200200000500 | NA | 2 | 3439.4946 | 20200200000502 | 21 | 1 | 200 | 1 | 34 | 73 | -1 | 99 |
| 3 | 2020 | 2 | 5 | 3203.8008 | 20200200000500 | NA | 3 | 4331.9871 | 20200200000503 | 1 | 1 | 200 | 99 | 0 | 1 | -1 | 99 |
| 4 | 2020 | 3 | 5 | 2076.8491 | 20200200001000 | NA | 1 | 2076.8491 | 20200200001001 | 48 | 1 | 100 | 99 | 10 | 111 | 5 | 2 |
We now have our extract dataset containing many samples which can be distinguished using the YEAR and MONTH variables. Before we go any further, let’s create a single variable that we can use to distinguish CPS samples in our extract. The code below creates a new variable called SAMPLE which is a concatenation of YEAR and MONTH.
cps_pandemic_df["SAMPLE"] = cps_pandemic_df['YEAR'].astype(str) + cps_pandemic_df['MONTH'].astype(str).str.zfill(2)
cps_pandemic_df.head()
| YEAR | SERIAL | MONTH | HWTFINL | CPSID | ASECFLAG | PERNUM | WTFINL | CPSIDP | AGE | SEX | RACE | YNGCH | EMPSTAT | EDUC | UH_INDMAJ_B2 | COVIDTELEW | SAMPLE | |
|---|---|---|---|---|---|---|---|---|---|---|---|---|---|---|---|---|---|---|
| 0 | 2020 | 1 | 5 | 1814.8895 | 20200300000400 | NA | 1 | 1814.8895 | 20200300000401 | 72 | 2 | 100 | 99 | 10 | 125 | 10 | 2 | 202005 |
| 1 | 2020 | 2 | 5 | 3203.8008 | 20200200000500 | NA | 1 | 3203.8008 | 20200200000501 | 21 | 2 | 200 | 1 | 34 | 73 | -1 | 99 | 202005 |
| 2 | 2020 | 2 | 5 | 3203.8008 | 20200200000500 | NA | 2 | 3439.4946 | 20200200000502 | 21 | 1 | 200 | 1 | 34 | 73 | -1 | 99 | 202005 |
| 3 | 2020 | 2 | 5 | 3203.8008 | 20200200000500 | NA | 3 | 4331.9871 | 20200200000503 | 1 | 1 | 200 | 99 | 0 | 1 | -1 | 99 | 202005 |
| 4 | 2020 | 3 | 5 | 2076.8491 | 20200200001000 | NA | 1 | 2076.8491 | 20200200001001 | 48 | 1 | 100 | 99 | 10 | 111 | 5 | 2 | 202005 |
Before we jump into any data analysis, let’s use the ipumspy.ddi.get_variable_info() method to take a look at the EDUC variable.
cps_pandemic_ddi.get_variable_info("EDUC")
VariableDescription(id=’EDUC’, name=’EDUC’, codes={‘NIU or no schooling’: 0, ‘NIU or blank’: 1, ‘None or preschool’: 2, ‘Grades 1, 2, 3, or 4’: 10, ‘Grade 1’: 11, ‘Grade 2’: 12, ‘Grade 3’: 13, ‘Grade 4’: 14, ‘Grades 5 or 6’: 20, ‘Grade 5’: 21, ‘Grade 6’: 22, ‘Grades 7 or 8’: 30, ‘Grade 7’: 31, ‘Grade 8’: 32, ‘Grade 9’: 40, ‘Grade 10’: 50, ‘Grade 11’: 60, ‘Grade 12′: 70, ’12th grade, no diploma’: 71, ’12th grade, diploma unclear’: 72, ‘High school diploma or equivalent’: 73, ‘1 year of college’: 80, ‘Some college but no degree’: 81, ‘2 years of college’: 90, “Associate’s degree, occupational/vocational program”: 91, “Associate’s degree, academic program”: 92, ‘3 years of college’: 100, ‘4 years of college’: 110, “Bachelor’s degree”: 111, ‘5+ years of college’: 120, ‘5 years of college’: 121, ‘6+ years of college’: 122, “Master’s degree”: 123, ‘Professional school degree’: 124, ‘Doctorate degree’: 125, ‘Missing/Unknown’: 999}, start=76, end=79, label=’Educational attainment recode’, description=”EDUC indicates respondents’ educational attainment, as measured by the highest year of school or degree completed. Note that completion differs from the highest year of school attendance; for example, respondents who\xa0attended\xa010th grade but did not finish were classified in EDUC as having\xa0completed\xa09th grade.\xa0\n\nEDUC is a combination of two other variables, HIGRADE and EDUC99, which measure educational attainment in different ways. HIGRADE is available for years prior to 1992 and gives the respondent’s highest grade of school or year of college completed. EDUC99 is available beginning in 1992 and classifies high school graduates according to their highest degree or diploma attained. \n\nGeneral and detailed codes are not yet available for IPUMS-CPS, but one can construct the general version of EDUC by reading only the first two columns of EDUC.”, concept=’Education Variables — PERSON’, vartype=’numeric’, shift=0)
There is a lot of info there, but it is kind of difficult to read. Let’s just take a look at the label and the codes.
# print the EDUC variable label
print(cps_pandemic_ddi.get_variable_info("EDUC").label)
# show the dictionary of values and value labels for EDUC
cps_pandemic_ddi.get_variable_info("EDUC").codes
Educational attainment recode
{‘NIU or no schooling’: 0,
‘NIU or blank’: 1,
‘None or preschool’: 2,
‘Grades 1, 2, 3, or 4’: 10,
‘Grade 1’: 11,
‘Grade 2’: 12,
‘Grade 3’: 13,
‘Grade 4’: 14,
‘Grades 5 or 6’: 20,
‘Grade 5’: 21,
‘Grade 6’: 22,
‘Grades 7 or 8’: 30,
‘Grade 7’: 31,
‘Grade 8’: 32,
‘Grade 9’: 40,
‘Grade 10’: 50,
‘Grade 11’: 60,
‘Grade 12’: 70,
’12th grade, no diploma’: 71,
’12th grade, diploma unclear’: 72,
‘High school diploma or equivalent’: 73,
‘1 year of college’: 80,
‘Some college but no degree’: 81,
‘2 years of college’: 90,
“Associate’s degree, occupational/vocational program”: 91,
“Associate’s degree, academic program”: 92,
‘3 years of college’: 100,
‘4 years of college’: 110,
“Bachelor’s degree”: 111,
‘5+ years of college’: 120,
‘5 years of college’: 121,
‘6+ years of college’: 122,
“Master’s degree”: 123,
‘Professional school degree’: 124,
‘Doctorate degree’: 125,
‘Missing/Unknown’: 999}
Oof. That is a lot of detail. Let’s write a function to recode EDUC into some more general categories.
def educ_recode(educ):
    if educ > 1 and educ < 73:
        return "less than HS diploma"
    elif educ == 73:
        return "HS diploma or equiv."
    elif educ >= 80 and educ < 111:
        return "some college"
    elif educ >= 111:
        return "bachelor's degree +"
    else:
        # NIU category recoded to np.nan
        # to avoid plotting errors later on
        return np.nan
Now we’ll apply that function to our extract data frame.
# apply the logic from educ_recode() to the EDUC variable in the cps_pandemic_df to create a new variable, EDUC_REC
cps_pandemic_df["EDUC_REC"] = cps_pandemic_df["EDUC"].apply(educ_recode)
# show the first five lines of the cps_pandemic_df data frame
cps_pandemic_df.head()
| YEAR | SERIAL | MONTH | HWTFINL | CPSID | ASECFLAG | PERNUM | WTFINL | CPSIDP | EMPSTAT | EDUC | COVIDTELEW | SAMPLE | EDUC_REC | |
|---|---|---|---|---|---|---|---|---|---|---|---|---|---|---|
| 0 | 2020 | 1 | 5 | 1814.8895 | 20200300000400 | NA | 1 | 1814.8895 | 20200300000401 | 10 | 125 | 2 | 202005 | bachelor's degree + |
| 1 | 2020 | 2 | 5 | 3203.8008 | 20200200000500 | NA | 1 | 3203.8008 | 20200200000501 | 34 | 73 | 99 | 202005 | HS diploma or equiv. |
| 2 | 2020 | 2 | 5 | 3203.8008 | 20200200000500 | NA | 2 | 3439.4946 | 20200200000502 | 34 | 73 | 99 | 202005 | HS diploma or equiv. |
| 3 | 2020 | 2 | 5 | 3203.8008 | 20200200000500 | NA | 3 | 4331.9871 | 20200200000503 | 0 | 1 | 99 | 202005 | NaN |
| 4 | 2020 | 3 | 5 | 2076.8491 | 20200200001000 | NA | 1 | 2076.8491 | 20200200001001 | 10 | 111 | 2 | 202005 | bachelor's degree + |
And there is our recode!
Let’s write one more function – this time to calculate the proportion of employed persons who were teleworking during the past month due to COVID-19.
def calculate_pct_employed_teleworking(df):
    # weighted count of those who are employed
    emp_count = df[(df["EMPSTAT"] == 10) | (df["EMPSTAT"] == 12)]["WTFINL"].sum()
    # weighted count of those teleworking
    telew_count = df[(df["COVIDTELEW"] == 2)]["WTFINL"].sum()
    telew_rate = telew_count / emp_count
    return telew_rate
Now let’s use this function to calculate the proportion of employed persons who worked remotely sometime in the last month in each survey month in our extract. The code below applies the calculate_pct_employed_teleworking() function to each month of CPS data included in our extract.
# group the cps_pandemic_df data frame by the SAMPLE variable and apply the function to
# calculate the % of employed persons teleworking due to COVID-19 to each group year/month group
telew_by_mo = cps_pandemic_df.groupby(["SAMPLE"]).apply(calculate_pct_employed_teleworking)
telew_by_mo
SAMPLE
202005 0.354226
202006 0.312215
202007 0.263953
202008 0.242727
202009 0.225941
202010 0.212115
202011 0.217468
202012 0.237102
202101 0.231885
202102 0.226039
202103 0.209262
202104 0.182340
202105 0.165375
202106 0.144161
202107 0.131433
202108 0.133667
202109 0.131832
202110 0.116379
202111 0.112573
202112 0.111171
202201 0.153361
202202 0.129668
202203 0.099738
202204 0.077008
202205 0.073423
202206 0.070467
dtype: float64
Let’s plot that so we can see the trend better.
# plot telew_by_mo data frame
telew_by_mo.plot()
# retrieve the current plot
ax = plt.gca()
# specify plot title
ax.set_title("Percentage of employed persons teleworking \nin the last month due to COVID-19, May 2020-June 2022")
# specify x axis label
ax.set_xlabel("Month")
plt.show()
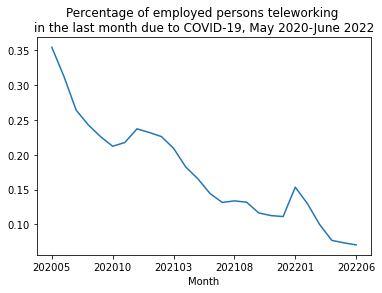
Teleworking in the past month due to COVID has trended downward since the beginning of the COVID-19 pandemic, but we can see spikes in the rates of teleworking around the delta wave in early 2021 and around the omicron wave in early 2022.
We can apply this same function to the extract grouped by SAMPLE and our recoded education variable.
# group the cps_pandemic_df data frame by the SAMPLE and recoded education variables and apply the function to
# calculate the % of employed persons teleworking due to COVID-19 to each group year/month group
telew_by_educ = cps_pandemic_df.groupby(["SAMPLE", "EDUC_REC"]).apply(calculate_pct_employed_teleworking)
# plot teleworking rates for each level of education by month
telew_by_educ.unstack("EDUC_REC").plot()
# retrieve the current plot
ax = plt.gca()
# specify a plot title
ax.set_title("Percentage of workers teleworking during the previous\nmonth due to COVID-19 by educational attainment,\nMay 2020-June 2022")
# specify an x axis label
ax.set_xlabel("Month")
plt.show()
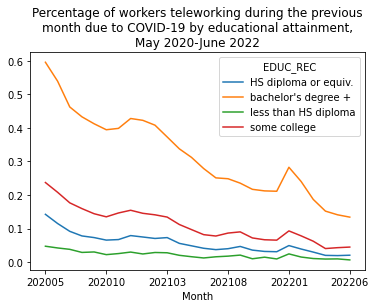
Here we can see that those with at least a bachelor’s degree are much more likely to telework due to COVID-19 and also that rates of working remotely increased the most for this group around the time of the delta and omicron waves.
So far so good. But what we really want is to be able to continue to track the prevalence of teleworking due to COVID-19 over time and refresh our analysis every month. Our workflow up to this point can be fairly easily modified each month to add new samples, but this will still require visiting the website to find the correct sample IDs and manual updating of our plot titles.
But…
What if we could just run our code as soon as IPUMS CPS lights up twitter to let us know that the newest Basic Monthly Survey (BMS) data is out and get our fresh results within minutes without any modifications or tweaks?
Let’s do that instead.
Automating the Workflow
Before diving into streamlining and automating the workflow, a word of caution: Users are strongly encouraged to check the IPUMS CPS website for any comparability issues or changes in their variables of interest in the newest month of data.
In order to automate IPUMS CPS data retrieval and analysis, we need to be a little more sophisticated in how we retrieve sample ID information and how we specify plot titles. To do this, we’ll need to get around the fact that IPUMS CPS does not currently offer a Metadata API. Readers may refer to the blog post on Helpful Functions for Constructing Reproducible Workflows in the Absence of an IPUMS Microdata Metadata API for more general information on this topic.
For our specific case, we want to be able to automatically retrieve a list of all sample IDs for IPUMS CPS BMS samples from May 2020, when COVID-19 question were first asked, to the present. The get_pandemic_sample_ids() function below takes a dictionary of sample descriptions and IDs as an argument and returns a list of sample IDs representing all IPUMS CPS BMS samples from May 2020 to the present.
def get_pandemic_sample_ids(cps_samples_dict):
    # get sample ID for May 2020
    may2020_id = cps_samples_dict["IPUMS-CPS, May 2020"]
    # find that id in a list of sorted sample IDs
    may2020_index = sorted(cps_samples_dict.values()).index(may2020_id)
    # grab all samples from may 2020 to the most recent
    may2020_on = sorted(cps_samples_dict.values())[may2020_index:]
    # only keep the BMS samples
    may2020_bms_on = [s for s in may2020_on if "03s" not in s]
    return may2020_bms_on
We will use CollectionInformation to get a dictionary of sample descriptions and IDs and pass that as an argument to get_pandemic_sample_ids(). At time of writing, July 2022 is the newest IPUMS CPS BMS sample. When we run this function, we can see cps2022_07b at the end of the list!
get_pandemic_sample_ids(utilities.CollectionInformation("cps").sample_ids)
[‘cps2020_05b’,
‘cps2020_06s’,
‘cps2020_07b’,
‘cps2020_08s’,
‘cps2020_09b’,
‘cps2020_10s’,
‘cps2020_11s’,
‘cps2020_12s’,
‘cps2021_01b’,
‘cps2021_02s’,
‘cps2021_04b’,
‘cps2021_05b’,
‘cps2021_06s’,
‘cps2021_07s’,
‘cps2021_08s’,
‘cps2021_09s’,
‘cps2021_10s’,
‘cps2021_11s’,
‘cps2021_12s’,
‘cps2022_01s’,
‘cps2022_02b’,
‘cps2022_03b’,
‘cps2022_04s’,
‘cps2022_05b’,
‘cps2022_06s’,
‘cps2022_07s’]
Now that we can grab the samples that we need programatically, and our variables of interest will not change from month to month (though we should check the online documentation to be sure), we can package the entire IPUMS CPS extract building, submitting, waiting, downloading, and reading process into a single function that will take this programatically obtained list of sample IDs as an argument.
def get_cps_pandemic_data(api_key, samples, variables, description):
    # open connection to API
    ipums = IpumsApiClient(api_key)
    # define extract
    cps_pandemic = CpsExtract(samples,
                              variables,
                              description=description)
    # submit your extract to the IPUMS extract system
    ipums.submit_extract(cps_pandemic)
    print(f"{cps_pandemic.collection} extract number {cps_pandemic.extract_id} has been submitted!")
    # wait for extract to complete
    ipums.wait_for_extract(cps_pandemic)
    print(f"{cps_pandemic.collection} extract number {cps_pandemic.extract_id} is complete!")
    # download completed extract data and ddi
    ipums.download_extract(cps_pandemic)
    # use cps_pandemic attributes to define the extract filename
    filename = f"{cps_pandemic.collection}_{str(cps_pandemic.extract_id).zfill(5)}"
    # read extract ddi
    cps_pandemic_ddi = readers.read_ipums_ddi(f"{filename}.xml")
    # read extract data
    cps_pandemic_df = readers.read_microdata(cps_pandemic_ddi, f"{filename}.dat.gz")
    return (cps_pandemic_ddi, cps_pandemic_df)
We can also contain our recoding and variable creation in a function, as this will also be the same in every month.
def generate_new_variables(df):
    # generate single-var sample IDentifier
    df["SAMPLE"] = df['YEAR'].astype(str) + df['MONTH'].astype(str).str.zfill(2)
    # recode educational attainment
    df["EDUC_REC"] = df["EDUC"].apply(educ_recode)
    return df
Packaging our code for making plots in functions will allow us to modify the dataframe on which they are based and the titles that we apply with each new month of data added to our analysis. Let’s follow the same procedure for the two plots we created above.
def plot_teleworking_rate(df, title):
    telew_by_mo = df.groupby(["SAMPLE"]).apply(calculate_pct_employed_teleworking)
    telew_by_mo.plot()
    ax = plt.gca()
    ax.set_title(title)
    ax.set_xlabel("Month")
    plt.show()
def plot_teleworking_rate_by_educ(df, title):
    telew_by_educ = df.groupby(["SAMPLE", "EDUC_REC"]).apply(calculate_pct_employed_teleworking)
    telew_by_educ.unstack("EDUC_REC").plot()
    ax = plt.gca()
    ax.set_title(title)
    ax.set_xlabel("Month")
    plt.show()
We can also use our pandemic_samples list from above to get some helpful info for those plot titles.
def get_plot_title_info(samples):
    # the first year is the 3rd-7th character
    # of the first sample in the sample list
    start_yr = samples[0][3:7]
    # the first month is the 3rd character from the end
    # through the 1st character from the end
    # of the first sample in the sample list
    start_mo = samples[0][-3:-1]

    # the last year is the 3rd-7th character
    # of the last sample in the sample list
    end_yr = samples[-1][3:7]
    # the last month is the 3rd character from the end
    # through the 1st character from the end
    # of the last sample in the sample list
    end_mo = samples[-1][-3:-1]

    # combine these years and months into a pretty string
    start = f"{calendar.month_name[int(start_mo)]} {start_yr}"
    end = f"{calendar.month_name[int(end_mo)]} {end_yr}"

    return(start, end)
Once we have done that setup, we can simply run our code every month to see the latest data point.
# get list of pandemic samples from may 2020 to the present
cps_samples_dict = utilities.CollectionInformation("cps").sample_ids
pandemic_samples = get_pandemic_sample_ids(cps_samples_dict)
# get CPS extract
(cps_pandemic_ddi,
 cps_pandemic_df) = get_cps_pandemic_data(os.getenv("IPUMS_MICRODATA_API_KEY"),
                                          pandemic_samples,
                                          # Note that YEAR and MONTH are pre-selected
                                          # and do not need to be added to this list
                                          ["EMPSTAT", "EDUC", "COVIDTELEW"],
                                          f"covid teleworking, {pandemic_samples[0]}-{pandemic_samples[-1]}")
# recodes and new variables
cps_pandemic_df = generate_new_variables(cps_pandemic_df)
# check to make sure those happened
print(cps_pandemic_df[["SAMPLE", "EDUC_REC"]].head())

# grab some info for pretty plot titles
(start, end) = get_plot_title_info(pandemic_samples)
# make plots!
plot_teleworking_rate(cps_pandemic_df,
                      f"Percentage of employed persons teleworking\nin the last month due to COVID-19, {start}-{end}")
plot_teleworking_rate_by_educ(cps_pandemic_df,
                              f"Percentage of workers teleworking during the previous\nmonth due to COVID-19"
                              f"by educational attainment,\n{start}-{end}")
cps extract number 27 has been submitted!
cps extract number 27 is complete!
YEAR SERIAL MONTH HWTFINL CPSID ASECFLAG PERNUM WTFINL CPSIDP EMPSTAT EDUC COVIDTELEW SAMPLE EDUC_REC
0 2020 1 5 1814.8895 20200300000400 NA 1 1814.8895 20200300000401 10 125 2 202005 bachelor's degree +
1 2020 2 5 3203.8008 20200200000500 NA 1 3203.8008 20200200000501 34 73 99 202005 HS diploma or equiv.
2 2020 2 5 3203.8008 20200200000500 NA 2 3439.4946 20200200000502 34 73 99 202005 HS diploma or equiv.
3 2020 2 5 3203.8008 20200200000500 NA 3 4331.9871 20200200000503 0 1 99 202005 NaN
4 2020 3 5 2076.8491 20200200001000 NA 1 2076.8491 20200200001001 10 111 2 202005 bachelor's degree +
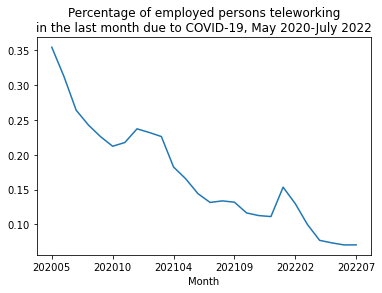
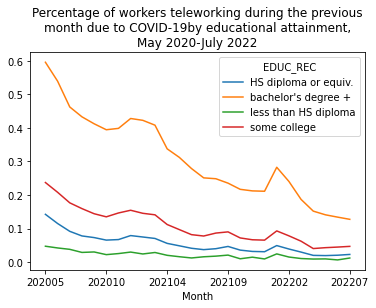
And there we have it! Our extract and subsequent plots now incude the most recent month of IPUMS CPS data and we did it all without leaving our code or even updating it!
Remember, Use it for Good!