New variables for augmenting IPUMS CPS data with external city-level data

By David Van Riper, Etienne Breton, and Sarah Flood

Have you ever wanted to link external city-level data to CPS respondents but were stymied by the city coding system used by the CPS? With the release of two new variables (PLACECENSUS and PLACEFIPS), IPUMS CPS has simplified the task of making such linkages.

The CPS identifies a limited number of sub-state geographic units (e.g., cities, counties) because of the complex assignment of CPS geographic identifiers (see working paper) and required minimum population thresholds. An additional layer of complexity is a custom coding scheme for central/principal cities (INDIVIDCC) that is unique to the CPS and, therefore, unfamiliar to most data users. IPUMS CPS has addressed this issue through the creation of two new variables – PLACECENSUS and PLACEFIPS – which provide standard codes for identifying central cities. These new variables will dramatically simplify the process of using IPUMS CPS to study specific cities, and will be particularly beneficial to those who want to augment the CPS data with city-level characteristics.

While metropolitan areas have almost always been identified in CPS (see METFIPS), central or principal cities – defined as the largest or one of the largest cities in metropolitan areas – were not identified in the data until October of 1985 (see INDIVIDCC). The identification of cities is great for users – they can focus their analyses on these cities (paying close attention to sample size and applying weights of course!). If analyses are confined to the CPS only, INDIVIDCC is adequate for use. However, attaching city-level characteristics to CPS data quickly becomes a problem given the native coding scheme for INDIVIDCC that is not used in other data products.

The new IPUMS CPS variables PLACECENSUS and PLACEFIPS help mitigate the challenge associated with augmenting city-level data from other sources with CPS data.

  • PLACECENSUS (available October 1985 to May 1995) uses Census city codes developed by the Census Bureau. The Census Bureau developed standard Census codes for cities that they applied to the 1970 and 1980 decennial censuses. The codes are assigned to each place in alphabetical order within a state.
  • PLACEFIPS (available September 1995 forward) uses FIPS codes. were developed by the National Institute of Standards and Technology (NIST) in the 1980s and have been used by the Census Bureau for decennial censuses since 1990 and in many other datasets published by the United States government (e.g., American Community Survey). FIPS codes are assigned to each place in alphabetical order within a state.
  • Neither PLACECENSUS nor PLACEFIPS are available for the June to August 1995 data. During this period, there are no sub-state geographic identifiers in the data.
  • PLACECENSUS and PLACEFIPS codes are unique within states, so users must combine the PLACECENSUS or PLACEFIPS codes with a state identifier (STATEFIP or STATECENSUS) to uniquely identify each central city.

Continue reading…

Measuring Food Security with U.S. Federal Data

By Kari Williams & Isabel Pastoor

The U.S. Department of Agriculture (USDA) defines a household as being food secure when all household members at all times have access to “enough food for an active, healthy life;” it sets a minimum threshold for food security of “ready availability of nutritionally adequate and safe foods” and the “assured ability to acquire acceptable foods in socially acceptable ways” (USDA Economic Research Service, 2025). The USDA provides survey modules for assessing food security in the U.S. (see Table 1), which are used in a number of federal surveys.

Following the recent announcement by the USDA that they plan to cease data collection for the Food Security supplement fielded as part of the December Current Population Survey, we are highlighting data sources for studying food security in the U.S. Table 2 provides an overview of a number of federal data sources that can be used to study aspects of food security in the U.S. This list of data sources is not exhaustive; we have prioritized data available through IPUMS and other long-running and large-scale population surveys. Additional sources covering shorter time periods or more specific focal populations can be found from the USDA’s Food Security in the United States Documentation page and the Food Access Research Atlas.

Continue reading…

What is going on with the weighted counts in the January 2025 CPS?

By Kari Williams & Sarah Flood

The signature activity of IPUMS is data harmonization, or making variables interoperable across time, to facilitate pooling of multiple months or years of data, as well as comparative and trend analyses. It’s easy to get carried away in the magic of not needing to perform routine data cleaning and having documentation organized at the variable level, and perhaps miss some bigger picture considerations. The Current Population Survey (CPS) annual population controls adjustment is an excellent example.

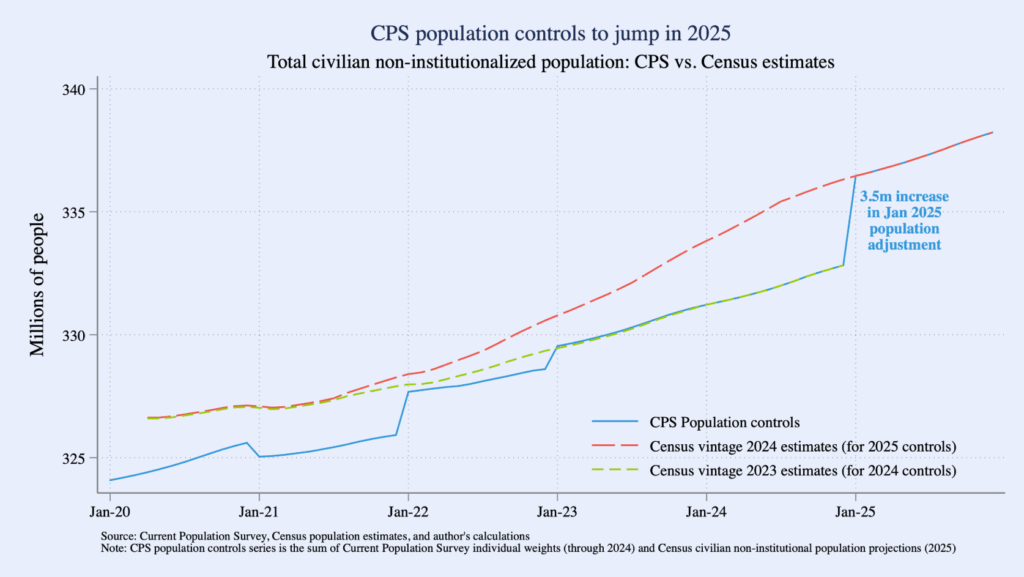
Each January, the Census Bureau revises the CPS weights to incorporate new population controls, based on the Census Bureau’s updated population estimates. However, the Census Bureau doesn’t re-release previous weights for the CPS based on the new population controls. If you look at trendlines of weighted count estimates using CPS monthly data, you might notice a discontinuity between each December and January – these are the annual population control adjustments at work. In January 2025, the shift is particularly abrupt; this is because the 2024 vintage population estimates (i.e., the population controls for the 2025 CPS) reflect an improvement in the Census Bureau’s methodology for measuring net international migration.

Line chart showing a general upward trend from 2020-2025 with disruptions each January

Figure from Jed Kolko’s Population adjustments will cause the next jobs report to be misinterpreted and misconstrued.

Continue reading…

IPUMS CPS Checks on Basic Monthly Data

By Sarah Flood, Renae Rodgers, and Kari Williams

Federal data are critical for understanding much about the US population from its size and composition to its health and employment. The Current Population Survey (CPS) is our nation’s official source of information about the labor force. At the beginning of each month, we eagerly await the first Friday when the Employment Situation Summary (aka the monthly jobs report) will be released (it isn’t just us, right??). The monthly snapshot of the US labor force serves as a bellwether for how our economy is faring.

The Wednesday after the jobs report is released, we at IPUMS clear the decks in preparation for the release of the CPS Basic Monthly Survey (BMS) by the Census Bureau. The CPS BMS is the individual-level data from which the jobs report is generated. Our goal is always to process these data as soon as they’re released by the Census Bureau so that we can deliver them to IPUMS CPS users as quickly as possible. Those who rely on CPS BMS data each month might be familiar with coping strategies while waiting for the data–obsessive page refreshing, some nervous pacing, maybe wondering why they haven’t yet been released (iykyk).

While quickly processing CPS Basic Monthly data is a priority, so, too, is ensuring data quality. Each month, we carefully inspect CPS BMS data at several points in our process. First, we review all of the variables for codes that are undocumented or have suspicious frequencies. Second, we rely on a suite of tools during our integration process that alert us to any codes in the data that we haven’t accounted for in our variable-level harmonizations. After harmonization, we compare univariate statistics from the newest month data to the previous month of data. Generally we expect very little change across months and we have built tools that are designed to flag variable-level differences above a certain threshold as well as new codes on either end of the distribution.

Continue reading…

Even More IPUMS Data Available in the SDA Online Data Analysis Tool

By Daniel Backman

Beyond offering the ability to create and download customized datasets from the IPUMS microdata collections, we also support web-based analysis of the data through the SDA (Survey Documentation and Analysis) online data analysis tool. SDA empowers users to analyze IPUMS data directly from their web browsers without the need for additional software or advanced programming skills. Whether you’re a seasoned researcher or a student exploring data for the first time, the SDA tool makes it easier than ever to unlock insights from our datasets. If you’re a current SDA user and ready to get started, check out the new datasets from IPUMS CPS and IPUMS MEPS. Otherwise, read on to learn more about SDA and how to use this tool to analyze IPUMS data.

About IPUMS & SDA

What is SDA?

The SDA tool is a web-based interface that allows you to generate frequency tables, cross-tabulations, and summary statistics; create customized data visualizations, including bar charts, line graphs, and scatter plots; perform regression analysis; and export results as a CSV file for presentations or further analysis.

SDA increases the accessibility of data by allowing users to analyze data through a web-interface without needing to use (or purchase!) statistical software. There is detailed guidance on how to use the tool for analyses and how to manipulate variables. Additionally, it provides exceptionally fast real-time processing of data, making it ideal for use in the classroom or other interactive settings. See our data training exercises page for exercises that will guide you through using SDA to analyze IPUMS data.

Continue reading…

IPUMS FAQ: Alternative Measures of Unemployment

By Matthew Bombyk

As part of the IPUMS mission to democratize data, our User Support team strives to answer your questions about the data. Over time, some questions are repeated. This blog post is an extension of an earlier series addressing frequently asked questions. Maybe you’ll learn something. Perhaps you’ll just find the information interesting. Regardless, we hope you enjoy it!

Here’s one of those questions:

How can I use IPUMS CPS to calculate the Alternative Measures of Unemployment published by the BLS?

Every month the Bureau of Labor Statistics (BLS) publishes a set of Alternative Measures of Labor Underutilization as part of its well-known Employment Situation News Release. A common question we are asked at IPUMS is how to calculate these rates using IPUMS CPS data. The “headline” unemployment figure is known as U-3 and is a straightforward calculation using only the main employment status variable, EMPSTAT. However, the other measures are not quite as simple. Nonetheless, these can be calculated using IPUMS CPS! Using the table below, you can calculate these rates using the public use microdata.

Continue reading…

Automating monthly workflows using IPUMS CPS and the IPUMS Microdata Extract API

By Renae Rodgers

As many readers will know, the Current Population Survey (CPS) is a monthly labor force survey that is, among other things, the data source for the monthly jobs report (or more formally the Employment Situation reports) from the Bureau of Labor Statistics.

In this blog post, I will show you how to create a reproducible, sustainable monthly workflow to update previous analyses using new data with IPUMS CPS data, IPUMS Microdata Extract API, and the ipumspy Python library.

If this is not your first CPS rodeo, you may already have a monthly workflow for working with IPUMS CPS data that suits your needs just fine – perhaps written in Stata. Did you know you can use ipumspy to make IPUMS CPS extracts from Stata?! Check out the set up instructions and template .do file in one of our previous blog posts and optimize your monthly analysis even more with the IPUMS Microdata Extract API!

But I digress. In this blog post, I will first walk through a simple analysis using the IPUMS Microdata Extract API and ipumspy. I will then show you how to package that workflow so that it can be simply executed monthly when the most recent data becomes available from IPUMS CPS for refreshed analysis including the newest data.

An example IPUMS CPS, IPUMS Microdata Extract API workflow: teleworking due to COVID-19

Let’s suppose that we’re interested in looking at trends in telework due to COVID-19 over the course of the pandemic. The IPUMS CPS variable COVIDTELEW indicates whether the respondent worked from home at any time during the past 4 weeks due to COVID-19. This example will show us the overall trend in remote work due to COVID-19 as well as how teleworking breaks down by educational attainment. First we’ll define an IPUMS CPS extract that contains COVIDTELEW and EDUC variables and all months from May 2020 to June 2022.

Continue reading…