
The IPUMS spatial team is excited to introduce two new products that expand the ways you can access NHGIS data. IPUMS GeoMarker enables you to easily attach contextual characteristics from ACS data to address or point data, and the first public IPUMS API provides programmatic access to NHGIS data and metadata. Both products officially moved out of beta in December 2019.
Data
New Year, New Me: IPUMS Bibliography
With a new year comes resolutions to become better versions of ourselves. Perhaps you have resolved to be more organized, appreciate the little things, or just reaffirm your commitment to using data for good-never for evil. Dream big because IPUMS wants to help you achieve your goals (unless you have again promised yourself that you will floss daily)!
We recently resolved to outperform Google*. An ambitious team, led by Erin Meyer, set out to close the gap between citation counts in the IPUMS bibliography and Google Scholar. They scoured the internet to uncover your incredible research accomplishments that use IPUMS data. And oh did they find research!
In the Archive: “25 Years of IPUMS Data”
“25 Years of IPUMS Data,” the current IPUMS/MPC archive exhibit, highlights a dynamic quarter center history of data innovation at the University of Minnesota. In the late 1980s, the Social History Research Laboratory at the University of Minnesota’s History Department proposed “the creation of a single integrated microdata series composed of public use samples for every year … with the exception of the 1890 census, which was destroyed by fire.” The primary aim was to make the U.S. census microdata “as compatible over time as possible while losing little, if any, of the detail in the original datasets” (Integrated Public Use Microdata Series: A Prospectus).
IPUMS Announces Winners of Annual Research Awards

IPUMS is excited to announce the winners of its annual IPUMS Research Awards. The awards honor the best of 2016’s published research and self-nominated graduate student papers that used IPUMS data to advance or deepen our understanding of social and demographic processes.
Data Release: U.S. Household-level Full Count Data from 1790-1840
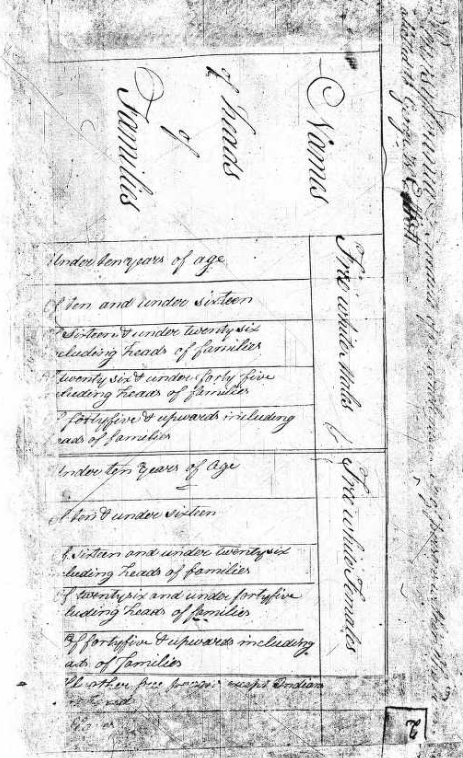
In collaboration with our partners at Ancestry.com, the Minnesota Population Center has released new historical census data through IPUMS-USA. Full count data for 1790-1840 is available via IPUMS-USA as household-level and county-level datasets* for each decennial census year and for the combined years, 1790-1840.
Wrangling International Census Tables
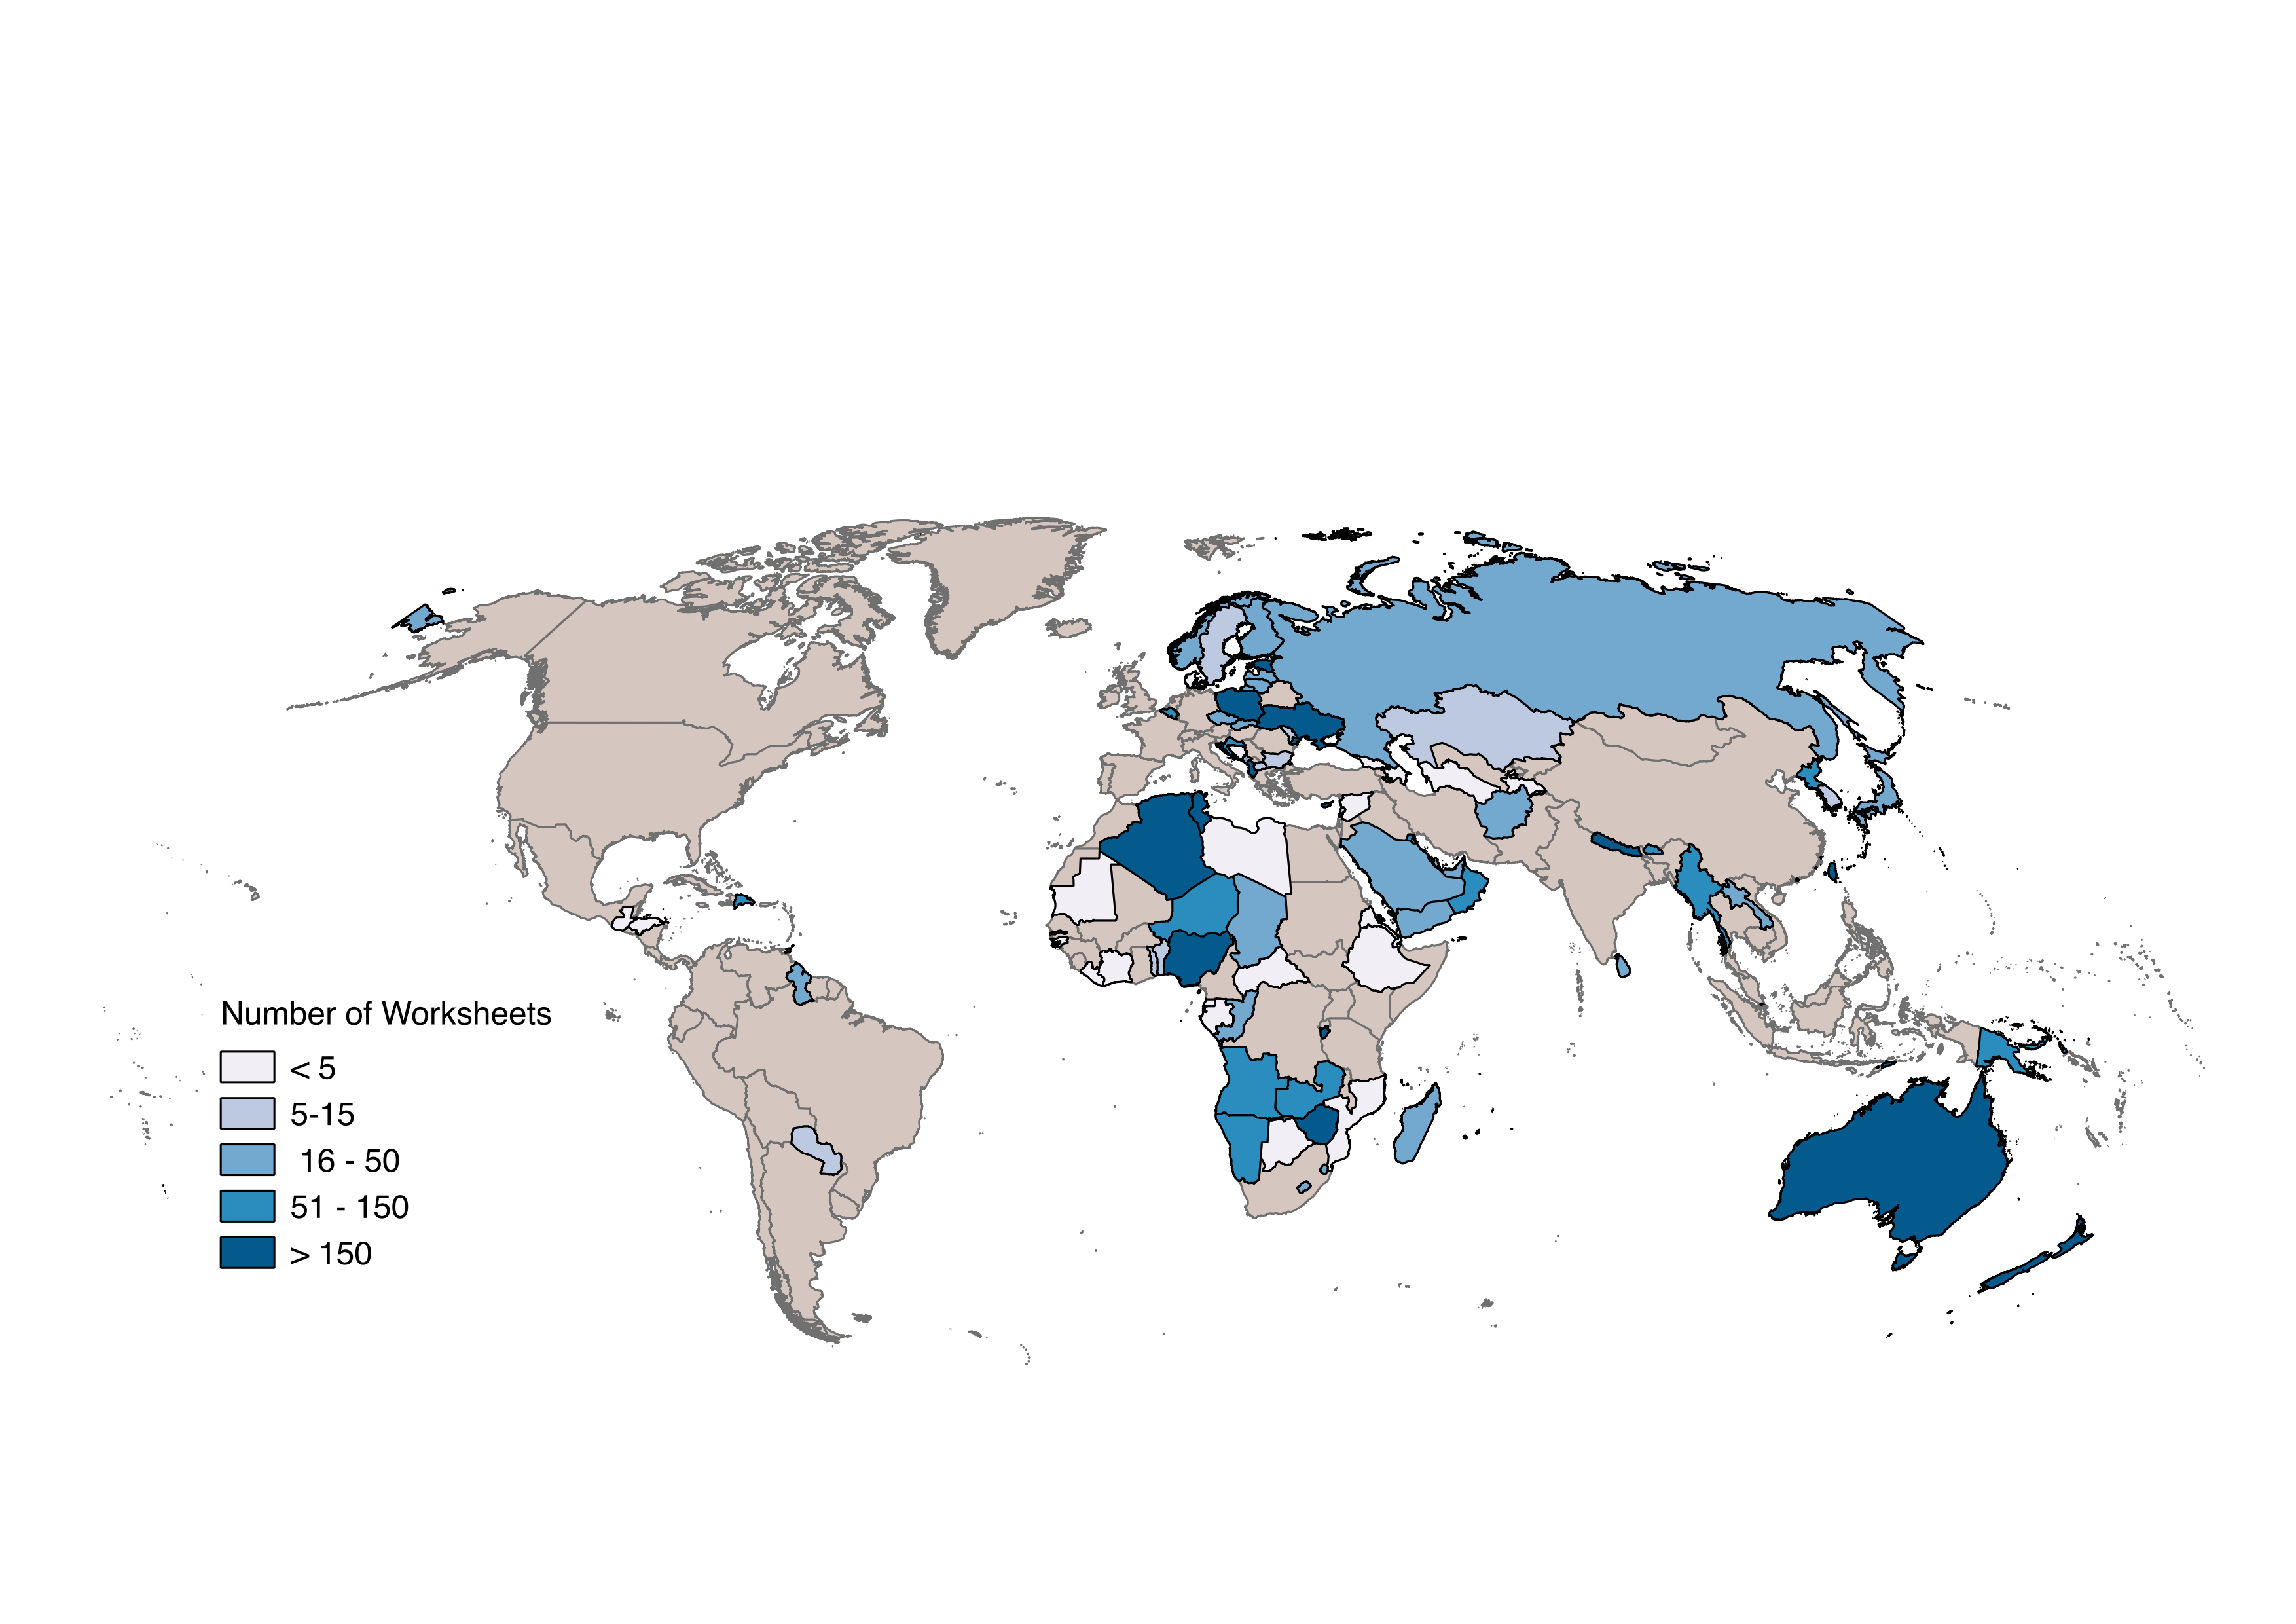 IPUMS-International currently disseminates census microdata from 82 countries around the world. It’s an impressive collection. But it still only covers about half the world’s countries. Under the TerraPop project, we are working to assemble a truly comprehensive global collection of population data.
Forging New Paths for Adulthood

We all know about what Phyllis Moen calls the linear lockstep life path: first learning, then working for advancement (or at least security), then retirement. What happens when this traditional path no longer fits the realities of most people’s lives?