Bivariate Proportional Symbol Maps, Part 1: An Introduction

By Jonathan Schroeder, IPUMS Research Scientist, NHGIS Project Manager

A powerful, underused mapping technique

The world could use a lot more bivariate proportional symbol maps. These maps pair two basic visual variables—size and (usually) color—to symbolize two characteristics of mapped features. When designed well, they convey multiple key dimensions of a population all at once: size and composition as well as spatial distribution and density.

A map of the share of population under age 18 in the Miami area in 2020. There is one colored circle for each census tract. There are five colors ranging from dark blue (representing less than 15% under age 18) to light green (representing 20 to 25% under age 18) to brown (representing 30% or more). The circle sizes correspond to tract populations. Most circles have similar sizes, representing around 1,000 to 10,000 people. The circles cluster together forming groups where there are more tracts and more people. The circles in central Miami and along the coast are bluer than elsewhere.
A bivariate proportional symbol map.
Click map for larger version.

Unfortunately, standard mapping software hasn’t made it easy to create good versions of these maps, and most introductions to statistical mapping stick to simpler strategies. As a result, bivariate proportional symbols aren’t used very often. With few examples and little guidance to go on, it’s understandable that mapmakers don’t realize how often they’re a viable, well-suited option.

This two-part blog series aims to spark more interest by providing a “few examples” (Part 1) and a “little guidance” (Part 2).

Picking up where I left off

In a previous blog post, I shared an example of a bivariate proportional symbol map and described some of the technique’s advantages. But that post focuses on a mapping resource (census centers of population) rather than on mapping techniques. Most of the examples in the post are also simply “proportional symbol maps,” without the more intriguing “bivariate” part.

To close that post, I suggested “a tantalizing next step” would be to use bivariate proportional symbols with small-area data (for census tracts or block groups), and I shared a few technical notes and design tips without much detail. I later expanded on those ideas in a conference talk, sharing some new examples with small-area data and going a little deeper with design tips.

In these new posts, I’m sharing and building on the examples and tips from the conference talk.

Continue reading…

Making Your Customized IPUMS MICS Data File

By Anna Bolgrien

The newest IPUMS data collection, IPUMS MICS, has many similarities with other IPUMS microdata collections. However, there is one major difference: the IPUMS MICS Data Extract System only uses Stata.

Yes, you read that right. Users of IPUMS MICS must use Stata to open and create their customized data file.

Let’s start with how using IPUMS MICS is the same as using other IPUMS microdata collections.

If you are an IPUMS user, you will find the process of browsing the variables, looking at documentation, and adding samples to your data cart completely familiar. If you are not familiar with IPUMS, you can read more about browsing and selecting variables.

However, when you finish choosing variables and samples in IPUMS MICS and click “Create Extract,” things start to look different.

Normally, you could change the data format, but the only option currently available for IPUMS MICS is a .dat (fixed-width text) file format.

Continue reading…

Introducing the MEPS Prescribed Medicines Data

By Julia A. Rivera Drew

The Household Component of the Medical Expenditure Panel Survey (MEPS), administered by the Agency for Healthcare Research and Quality (AHRQ), is a short panel survey collecting information for a nationally representative sample of the civilian, noninstitutionalized population. Since 1996, the MEPS has collected information on demographic and socioeconomic characteristics; health status; medical conditions; and health care access, utilization, and expenditures.

Based on information provided by a family respondent about each family member at each interview, AHRQ produces a dataset of all reported fills of prescribed medicines purchased by family members during the calendar year (including refills). For example, if a prescription was filled monthly, there would be 12 records for that specific prescribed medicine (DRUGID) in the annual file. The prescribed medicines data includes information such as the medication name (RXNAME), national drug code (RXNDC), therapeutic classification (MULTC1), when the person began taking the medication (RXBEGMM and RXBEGYR), amounts paid (RXFEXPTOT), and source of payment (RXFEXPSRC).

IPUMS MEPS provides a harmonized and integrated version of the MEPS Household Component data, including data from the prescribed medicines files.

Continue reading…

2022 ATUS Eating and Health Module Data: New Variables and Updates

By Annie Chen & Sarah Flood

The American Time Use Survey Eating and Health Module, funded by the Economic Research Service, asks a series of questions related to grocery shopping, food preparation, and nutrition. The most recent module was fielded in 2022 during the COVID-19 pandemic and was previously fielded in 2006 to 2008 and 2014 to 2016. The 2022 Eating and Health Module, set to be fielded again in 2023, asks new questions, asks similar questions in different ways than previously fielded modules, and contains additional variables of high interest to researchers.

New Variables in 2022

The 2022 ATUS Eating and Health Module asks a series of new questions related to exercise/physical activity, grocery shopping, meal preparation, and food quality. The food quality questions are especially interesting because they provide researchers with the opportunity to assess relationships between food quality and time use, which hasn’t been possible previously with these data. This is the first time that the ATUS has asked any information about respondents’ food intake on the ATUS diary day. The module is also responsive to changes in shopping behavior during the pandemic, specifically online grocery shopping and grocery delivery/pickup options. The shopping and meal preparation enjoyment questions might allow for comparisons to the ATUS Well-Being Module (fielded in 2010, 2012, 2013, and 2021).

Continue reading…

Announcing IPUMS MICS

By Anna Bolgrien

IPUMS MICS Logo

IPUMS has an exciting new data collection to announce: IPUMS MICS!

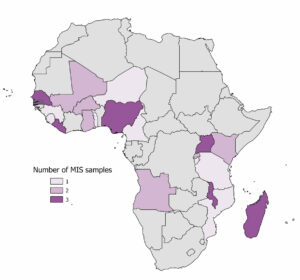
IPUMS MICS is the integrated version of UNICEF MICS (Multiple Indicator Cluster Surveys), the largest and most robust source of data on women and children’s well-being across the globe, including countries in Africa, Eastern Europe, Asia, and Latin America. Separate datasets cover women of childbearing age, children aged 0 to 4, children aged 5 to 17, respondent’s birth history, men, household members, and household characteristics.

Currently, IPUMS MICS includes harmonization of data from 202 MICS samples, which represent 88 countries, and cover surveys conducted between 2005-forward. There are over 800 integrated variables currently available on our website. Future releases will expand the sample and variable coverage of IPUMS MICS.

Continue reading…

Accessing IPUMS NHGIS in R: A Primer

By Finn Roberts & Jonathan Schroeder

R users have a powerful new way to access IPUMS NHGIS!

The July 2023 release of ipumsr 0.6.0 includes a fully-featured set of client tools enabling R users to get NHGIS data and metadata via the IPUMS API. Without leaving their R environment, users can find, request, download and read in U.S. census summary tables, geographic time series, and GIS mapping files for years from 1790 through the present. This blog post gives an overview of the possibilities and describes how to get started.

What you can do with ipumsr

Request and download NHGIS data

You can use ipumsr to specify the parameters of an NHGIS data extract request and submit that request for processing by the IPUMS servers. You can request any of the data products that are available through the NHGIS Data Finder: summary tables, time series tables, and shapefiles. You can also specify general formatting parameters (e.g., file format or time series table layout) to customize the structure of your data extract.

Once you have specified a data extract, you can use a series of ipumsr functions to:

  • submit the extract request to the IPUMS servers for processing
  • check on the extract status
  • wait for the extract to complete
  • download the extract as soon as it’s ready
  • load the data into R with detailed data field descriptions.

This workflow allows you to go from a set of abstract NHGIS data specifications to analyzable data, all without having to leave your R session!

Continue reading…

Going Global: IPUMS International

By Diana Magnuson

Display case with a banner "Going Global: IPUMS International" and memorabilia from around the world
The display case at IPUMS HQ

A new exhibit, “Going Global: IPUMS International,” is now on display at IPUMS headquarters, housed at the University of Minnesota. The exhibit features pieces that tell the history and scope of IPUMS International.

Beginning in 1999 with a social science infrastructure grant from the National Science Foundation, IPUMS International had a simple yet audaciously ambitious goal: preserve the world’s microdata resources and democratize access to those resources. Twenty-four years later, the goals are: collecting and preserving census and survey data and documentation; harmonizing those data; and disseminating the harmonized data free of charge. The data series includes information on an impressive range of population characteristics, including fertility, nuptiality, life-course transitions, migration, labor-force participation, occupational structure, education, ethnicity, and household composition.

Dr. Bob McCaa standing behind a table with stacks of paper
Dr. Bob McCaa

Source data for IPUMS International are generously provided by participating national statistical offices. Our staff develop and nurture relationships with representatives of NSOs from around the world. As IPUMS International got underway, co-principal investigator Dr. Bob McCaa, University of Minnesota Department of History, “proved to have formidable persuasive powers and managed to convince . . . agency directors of the benefits of preservation and access to scientific information.” Over time, IPUMS International developed a team of research scientists articulating to a broad international audience the significance of the IPUMS data collection, harmonization, and preservation work. Today, an NSF advisory committee, senior personnel including research scientists and data analysts, an external advisory panel, and graduate and undergraduate research assistants all support the work of IPUMS International.

Continue reading…