By Diana L. Magnuson; Curator and Historian, ISRDI
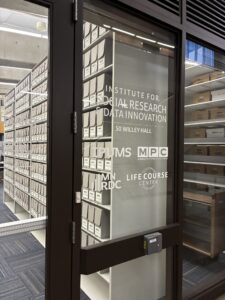 For a quarter century archival staff and the physical collection of IPUMS archival materials have sojourned in spaces on the West Bank at the University of Minnesota. The People’s Center on Riverside Avenue, the fifth floor of Heller Hall, 50 Willey Hall, 1200 Washington Avenue and the West Bank Office Building on South 2nd Street have all been home to the IPUMS Archive. These moves were embedded in the organizational growth, development, and change experienced by the IPUMS projects from 1999 to the present. Since 2004, IPUMS headquarters have been in 18,500 square feet of renovated space in Willey Hall on the West Bank. The space was a $1.8 million College of Liberal Arts funded remodel of an art gallery and restaurant. Now home to the Institute for Social Research and Data Innovation, which houses the Minnesota Population Center (MPC), IPUMS, the Life Course Center (LCC), and the Minnesota Research Data Center (MnRDC), the space currently contains six private offices, ninety-one cubicles, lounge spaces, and twelve conference room spaces, including a large ninety seat capacity seminar room.
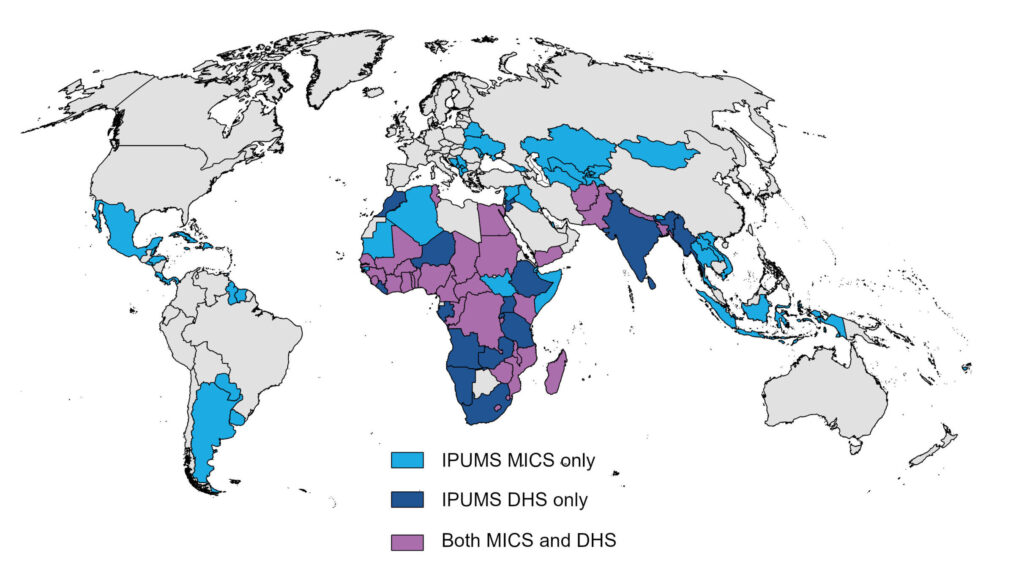
The IPUMS Archive began in earnest with the launch of IPUMS International (affectionately known as IPUMS-I in some circles), which, as of this writing, includes 104 countries; 656 censuses and surveys, and over 1-billion person records. Beginning in 1999, with a social science infrastructure grant from the National Science Foundation (NSF), IPUMS International (IPUMS-I) had the ambitious goal to preserve the world’s microdata resources to democratize global access to these rich resources. In 2025, the project goals continue to be: collecting and preserving census and survey data and documentation; harmonizing these data; and disseminating the harmonized data free of charge.