
Benjamin Hartman is a 2016 Summer Diversity Fellow at the MPC. As part of his fellowship, he learned how to take unprocessed data to produce harmonized IPUMS-I data and documentation, make GIS maps, and conduct his own case study investigating the spatial dimensions of internal migration using the Cambodian census. Hartman worked with his colleagues in IPUMS International to create this blog post.
When National Statistical Offices (NSOs) entrust their census data samples to the Minnesota Population Center, the data is not received in a format that is immediately usable and distributable. For researchers to be able to use the data it is first translated into a format that allows for the most comparability between sample years and between countries. The original data code is “translated” into the IPUMS International coding scheme, while the unique qualities are kept for those who are interested. Translating the original data into the IPUMS International coding scheme creates one set of codes that can be used to create public use files of countries’ censuses that are able to be compared and analyzed across time and samples. I worked on one such migration variable, which is constructed by whether or not the person previously lived in the same location or abroad. Location is defined as the primary or secondary administrative unit within the country. To put this into the U.S. context, the primary administrative unit would be the state, and the secondary administrative unit would be the county.
In addition to census microdata, IPUMS gathers administrative boundary files. These files are provided by the NSOs or are digitized from paper maps. As a country’s internal boundaries are not always consistent across all of the sample years, IPUMS staff harmonize the internal boundaries across time. For example, if any administrative unit within a country is divided into three units from one census year to another, the harmonized boundary file would combine all three of the new units to form a single unit identical to the boundary from the first census. I worked on creating spatially consistent regions and districts for the Tanzanian censuses of 1988, 2002, and 2008. In Tanzania, regions are first level administrative units, and districts are second-level administrative units. I matched the GIS boundary files to the microdata codes from the Tanzanian NSO.
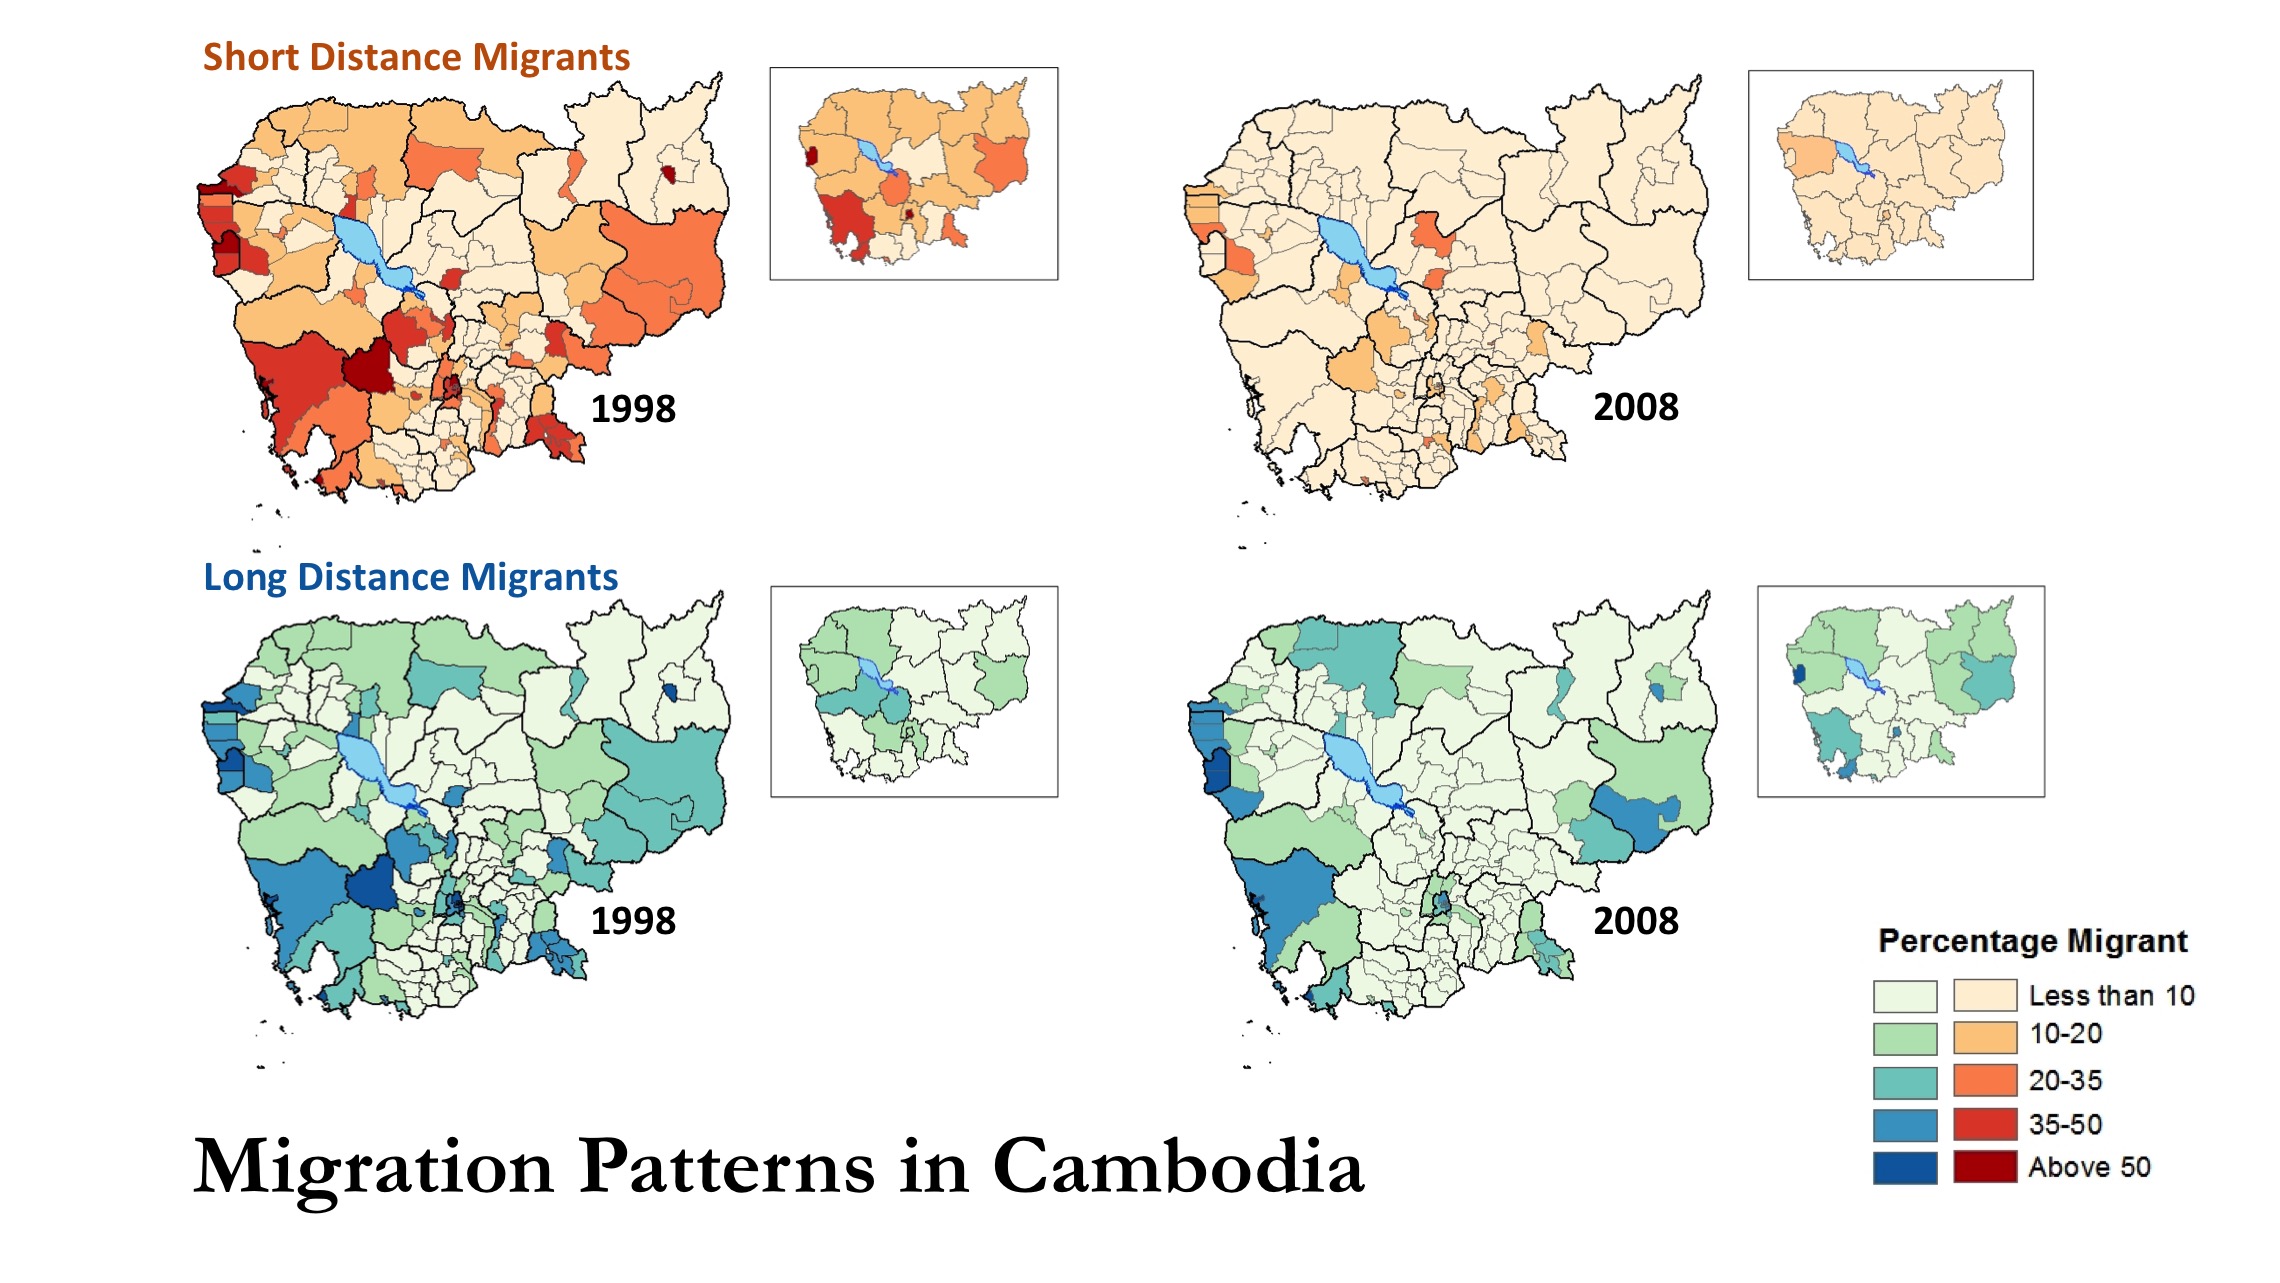
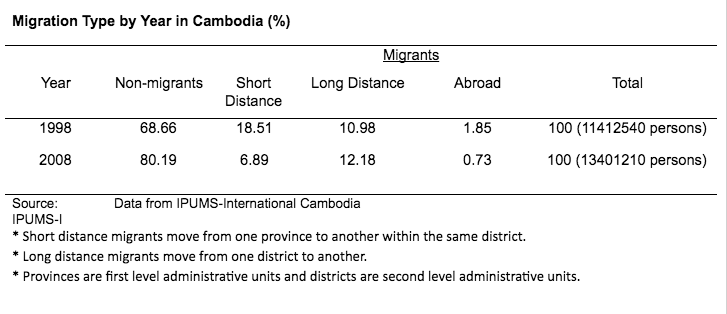
Using both the maps and microdata, I applied my new knowledge to understanding the circumstances of migration in Cambodia. In the summer of 1997, Cambodia faced violent clashes for political power which resulted in a transition in the government structure of the nation. The table below shows individuals migrating short distances within the provinces in Cambodia in 1998, possibly as a result of the change in political power. In contrast, in 2008, long distance migration (movement between districts) was more frequent.
Using the Cambodian data from IPUMS International (10% samples), I analyzed several migration-related variables, and I used GIS to visualize migration patterns at different geographical scales. From the maps, I found that migration in Cambodia has declined overall since 1998. In some areas, like around the capital, migration patterns have remained fairly constant.The pattern of migration indicates that people traveled shorter distances in 1998, when the country was politically unstable, while moving longer distances when the country stabilized again in 2008.
Given the varying levels of between-province migration, looking more closely at each province gives us better insight into the patterns of migration at a finer scale between-districts within the provinces. Understanding the regional structuring and movement within Cambodia can help shed light on the ramifications of the political transition following 1997 and the transformation of the nation after the Khmer Rouge.
This case study helped me develop a more complete analysis of the complex impact of the political shift on the lives and decisions of individuals living in Cambodia, as well as highlight the potential benefits of spatial analysis.
Through my experience as a Summer Diversity Fellow at the Minnesota Population Center, I observed the uses and importance of census microdata and spatial data, while also gaining new insights on the work of taking unprocessed data and producing usable and distributable harmonized data, documentation, and maps.
Story by Benjamin Hartmann with help from Besufekad Alemu, Baishali Bakshi, Brit Henderson, and Sula Sarkar. Benjamin Hartmann is a senior at the University of Minnesota studying Sociology, History, and Asian American Studies. Ben can be reached at hartm411@umn.edu.