
By Dan Ehrlich
Have you ever wanted to share a project using IPUMS data with a colleague, but then thought, “Oh wait! It is against the terms of use to redistribute my IPUMS data file!”
Maybe you’d like a colleague to explore your findings. Or maybe you’re a teacher with an exercise you’d like your students to review and replicate. In the past, if you wanted someone to use the same IPUMS data that you did, you would need to provide a list of samples and variables and instructions for your collaborator on how to navigate the online data extract system.
If you’re thinking that sounds like a pain, don’t worry, the brand new IPUMS microdata API makes it easier than ever to share your extract definitions with fellow IPUMS users!!! Using the microdata API, you and your collaborators can:
- Save an extract definition as a .json file that can be shared freely
- Submit a new extract request based on a .json definition
- Download data and metadata directly into your project directory (this feature is a personal favorite)
The latest version of ipumsr contains new functions allowing users to call on the IPUMS microdata API directly from R or RStudio. Python users should check out ipumspy. For more on the microdata API check out these other recent blog posts:
- Introduction to the API
- Using the API with ipumsr
- Making IPUMS extracts from Stata
- Sharing extract definitions with ipumspy
In this post, I’ll first introduce the ipumsr functions for saving an extract definition to a .json file and loading a saved definition from .json. Then, I’ll demonstrate two use-cases for those functions: sharing an analysis in an R Markdown document, and sharing an interactive application created with Shiny. Note that the code examples here will only work once you’ve (1) requested beta access to the IPUMS microdata API by emailing ipums+api@umn.edu and (2) set up your API key.
Sharing extracts using ipumsr
To share an extract using ipumsr, you first need an extract definition to work with. Although you can create a new extract definition with define_extract_usa() or define_extract_cps(), you can also pull down the definition of a previously submitted extract with get_extract_info(). This works whether you created the extract with API functions or with the online extract system. To pull down the definition of your IPUMS USA extract number 10, you would use:
extract_to_share <- get_extract_info("usa:10")
Once you have your extract definition stored in a R object like extract_to_share, you can save that definition to a .json file with:
save_extract_as_json(extract_to_share, file = "extract_to_share.json")
Then you can share the file extract_to_share.json with a collaborator, or in a public repository such as GitHub, and anyone with the file can submit their own identical extract request with:
cloned_extract <-
define_extract_from_json("extract_to_share.json")
submit_extract(cloned_extract)
Sharing an analysis in R Markdown
R Markdown is a plain-text file format that allows you to combine prose, code, and analysis output (like tables and graphs) into one document. To help users share an analysis of IPUMS data in an R Markdown document, we’ve created a new R Markdown template, the “Rmd for Reproducible Research” (RRR). You can download the template as a standalone file here, or you can install the development version of ipumsr (by following the instructions here) and access the template through the RStudio menu interface as shown below. We also plan to include this template in the next ipumsr CRAN release in the coming months.
The beauty of the RRR is that it allows your collaborators to run your analysis out-of-the-box, without taking any separate steps to download the data. How does it accomplish this? Let’s take a look.
The first step in using the RRR workflow is to create a data extract. While it is possible to create extracts entirely within R, many users (this author included) may want to use the online IPUMS extract system to create and submit their extracts. Once you’ve submitted your extract, take note of the extract number, then begin working with the RRR as follows.
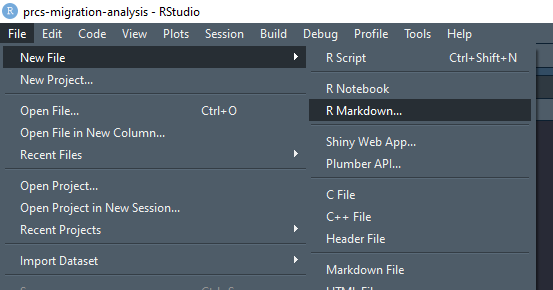
If you’ve installed the development version of ipumsr, you can access the RRR template through the RStudio File menu. In RStudio, select File > New File > R Markdown:
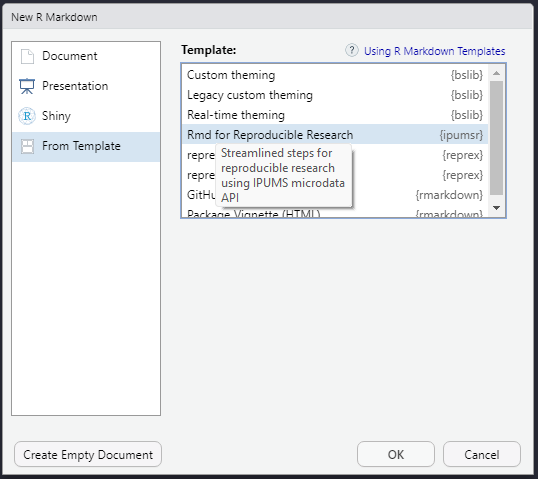
In the popup menu, select “From Template” in the left sidebar, then “Rmd for Reproducible Research” from the list of templates, and click OK:
Now here we are, looking at a wall of instructions:
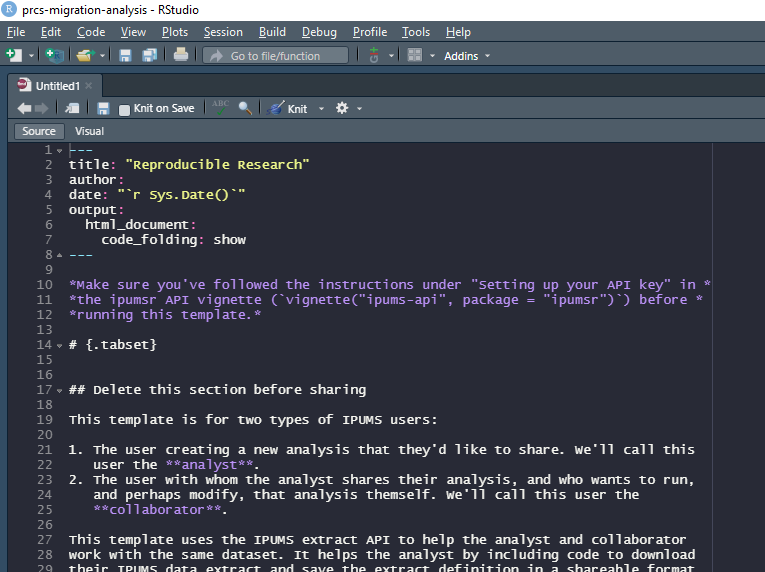
But don’t worry! We’ve tried to make this as painless as possible. In just a few steps you’ll have your IPUMS data downloaded and the framework for a shareable analysis project. These steps are described in a bit more detail in the template itself, but we’ll walk through them quickly here.
First, scroll down to the first code chunk, labeled “project-parameters”, and fill in values for the four parameters defined there, as shown below: the IPUMS collection and extract number of your submitted extract, a descriptive name for your extract, and a subfolder in which to save your data files.
collection <- "usa"  # The IPUMS data collection of your extract; run
                     # `ipums_data_collections()` for a list of supported
                     # collections

extract_num <- NULL # The extract number, or leave as `NULL` for your most
                    # recent extract

descriptive_name <- "my_ipums_extract" # A descriptive label for your extract;
                                       # used to rename your data files

data_dir <- "data" # The folder in which to save data, codebook, and .json files
In fact, you can leave all the default values of these parameters if you want to analyze your most recent IPUMS USA extract, though I’d recommend filling in a better descriptive_name for the extract even in that case. Since I’ll be using IPUMS USA data on migration from the Puerto Rico Community Survey, I’ll fill in “prcs_migration_analysis” for descriptive_name.
After filling in values, save the file, then click the RStudio “Knit” button, and awaaaaaaay it goes! All that’s left to do is sit back, relax, and –

…wait, is that an error???
Yes, technically, the script did throw an error, but it did so by design. The RRR is designed to check whether your extract is ready to download and stop execution if it isn’t. IPUMS extracts can take anywhere from a few minutes to a few hours to process, depending on their size and traffic levels in the extract engine.1 If you get this error message, your extract hasn’t completed yet. You can keep clicking the “Knit” button again and again to keep checking your extract’s status and download it if it is ready, or you can wait until you know it has completed (either because you’ve received an “extract is ready” email, or you checked the status on your “My Data” page on the web) before clicking on “Knit” again.
In other words, yes it was an error, but it was deliberate!
Once your extract is ready, clicking the “Knit” button will produce an HTML report that looks like this:
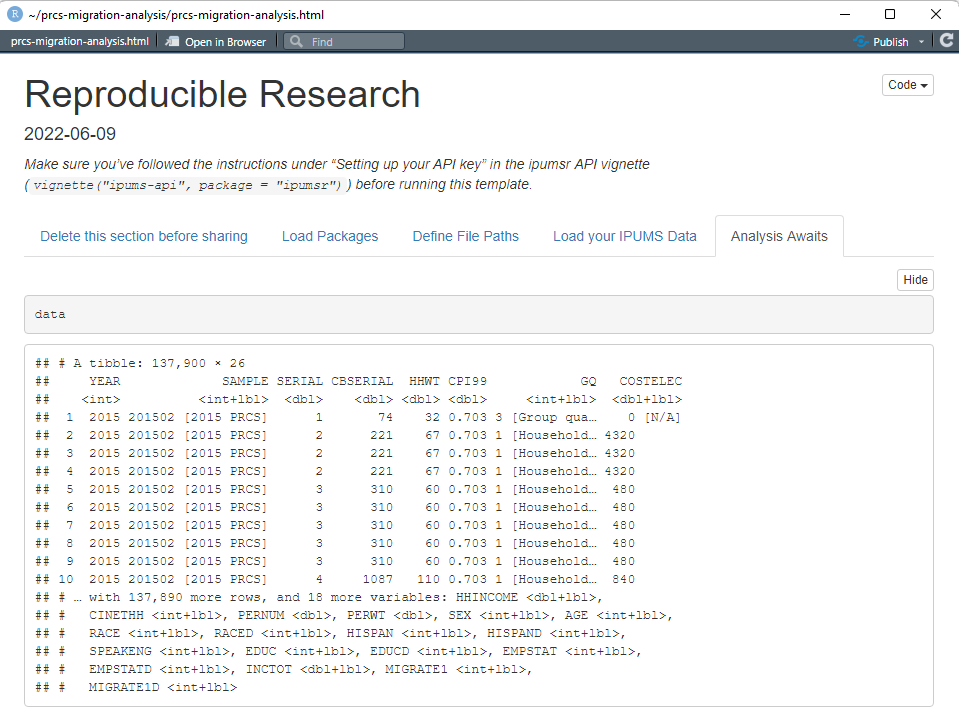
With just a couple clicks, we’ve pulled our most recent IPUMS USA data extract DIRECTLY into our R project! (I really can’t overstate how cool this feature is.)
Now for some clean up to get your analysis ready to share. In the HTML report, click the “Delete this section before sharing” tab and scroll to the very bottom to find some output like the following:
Data, codebook, and .json extract definition files have been saved to folder "data".

Next, copy the code below into the "Define File Paths" code chunk, overwriting the existing code:

extract_definition_path <- "data/prcs_migration_analysis.json"
data_path <- "data/prcs_migration_analysis.dat.gz"
ddi_path <- "data/prcs_migration_analysis.xml"

Finally, delete all text and code in the section "Delete this section before sharing"
As the instructions indicate, copy the three lines defining file paths and paste them back into the R Markdown template file, overwriting the existing code. This will hard code the paths to the .json, data, and DDI codebook files so that we can delete the first section of the report, where those paths were initially defined. Next, delete the section labeled “Delete this section before sharing” from the R Markdown. This section is designed to be deleted because it contains set up code and instructions for you, the creator of the original analysis, which are not necessary or relevant to your collaborators.
From here, you can fill out the remainder of the RRR with whatever analysis you’d like, such as plotting migration rates over time:
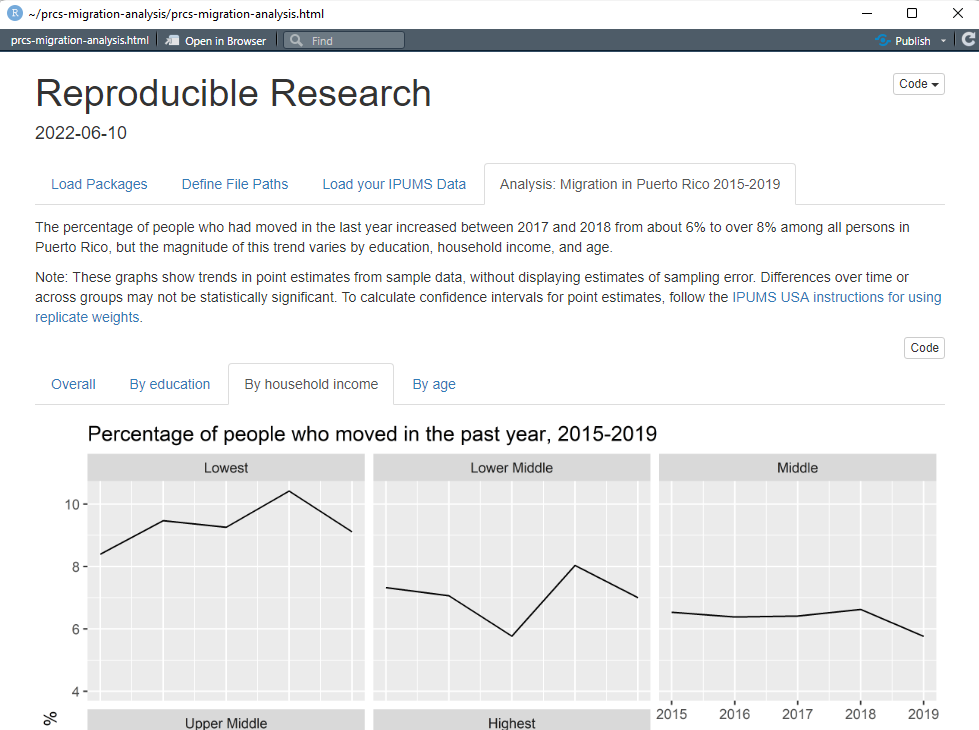
Then, when you’re ready to share your analysis so others can replicate or build on it, just share the R Markdown file and subfolder containing the .json extract definition, and prospective collaborators can run your code without any modification (though they will have to wait for their own copy of the data extract to be processed). Or you can create a GitHub repository for your project to share it publicly – check out the free online book Happy Git and GitHub for the useR for helpful tips on working with Git and GitHub in R.
You can access the migration analysis example, built from the RRR template, in the ipums/simple-api-shiny-app GitHub repo. You can also browse the pre-built HTML report screenshotted above.
This template is a work in progress, so be sure to share your feedback by emailing us at ipums+cran@umn.edu or creating an issue on GitHub.
Sharing an interactive Shiny app
Shiny is an R package that helps users create interactive web applications without writing any HTML or JavaScript. To demonstrate how you can use the IPUMS API to power a Shiny application that collaborators can run themselves, we’ve created an app to browse visualizations of your IPUMS extract, which I’ve dubbed the Variable Variation Value Viewer (VVVV), available in the same ipums/simple-api-shiny-app GitHub repo linked above.
This app follows the same steps as the RRR, but it also makes use of the wait_for_extract() function. That’s right, you can define, submit, wait for, and download your IPUMS data all automatically…though you may be waiting a little while for larger extracts. The extract used in this example is intentionally small so that users do not need to wait long (usually < 1 min) for the app to load. Like the RRR, this app is a work in progress, but it does provide a pretty neat way to show users what you’ve done…
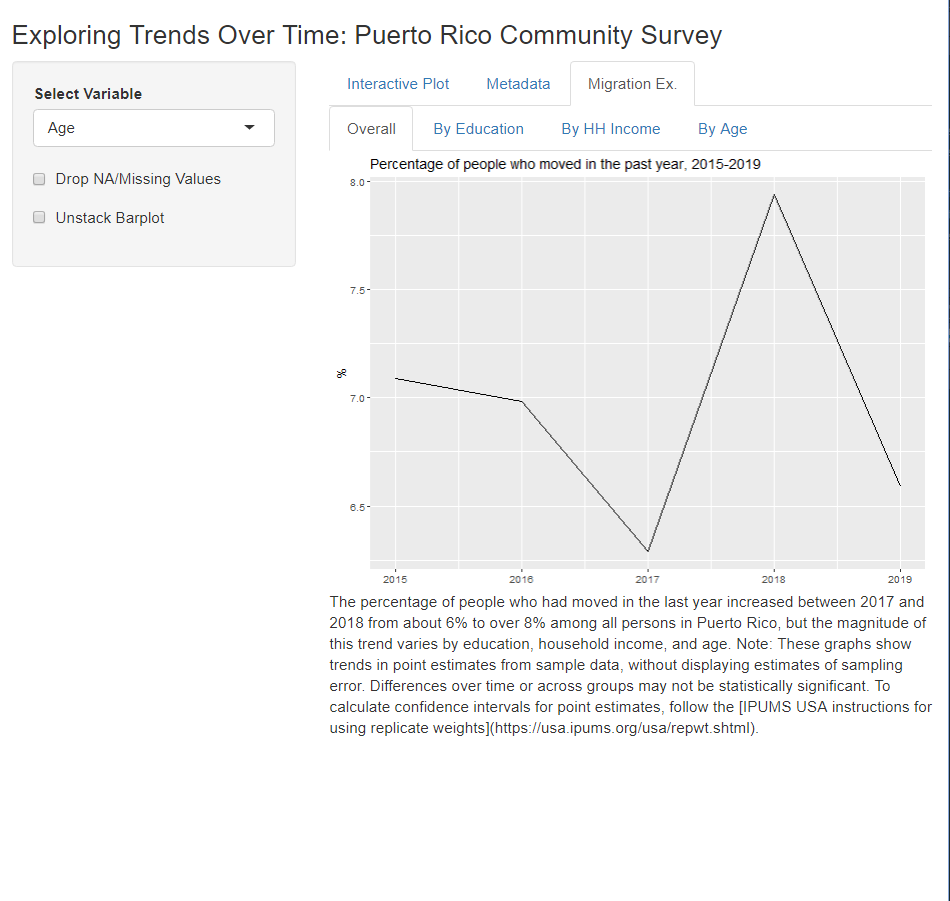
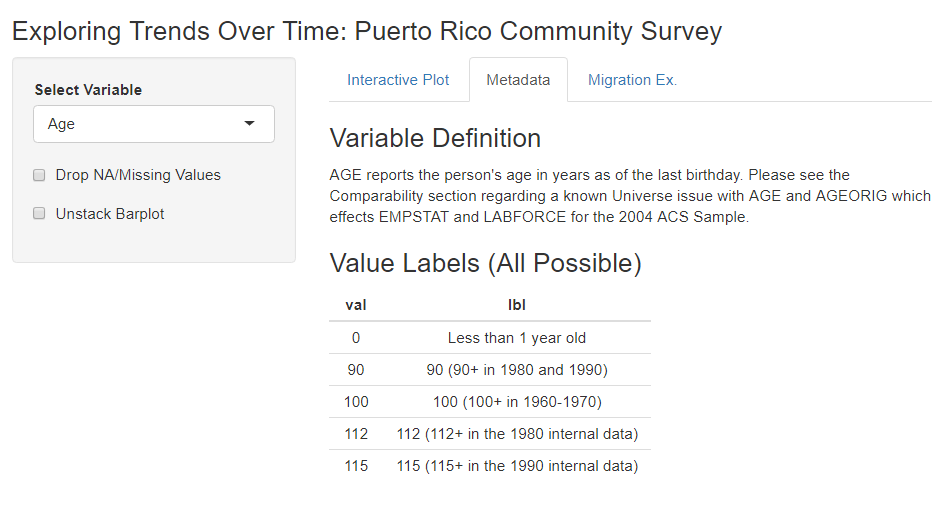
…and let them explore further trends…
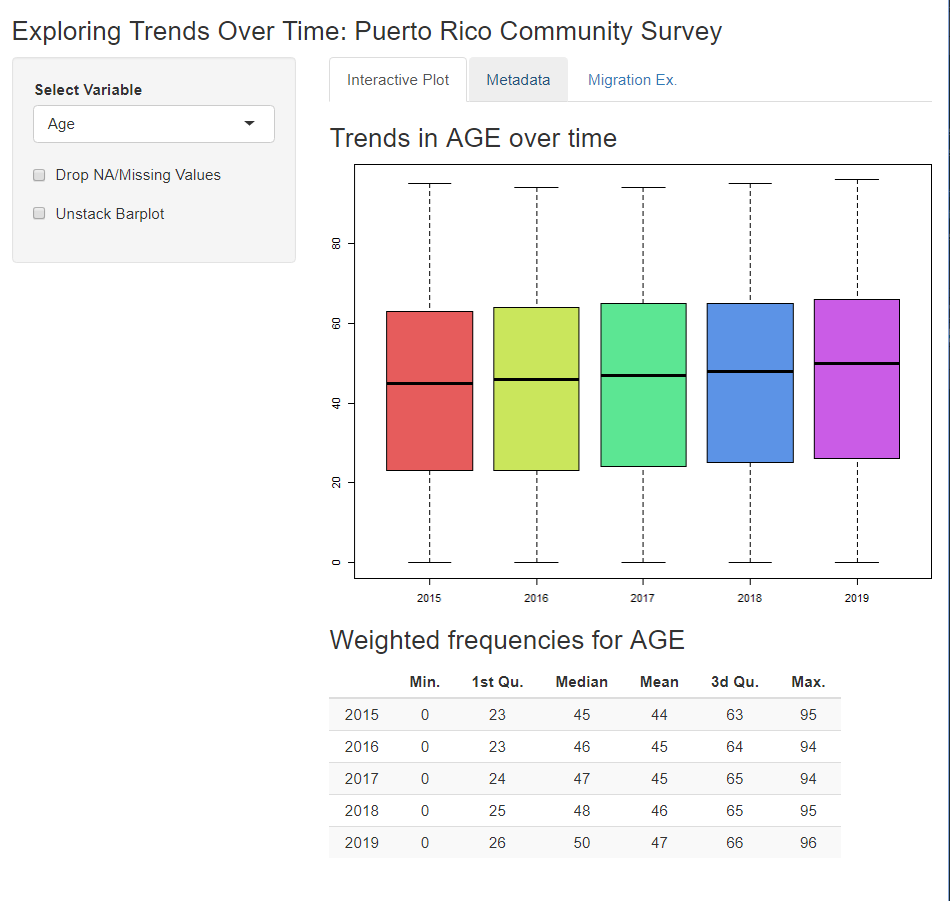
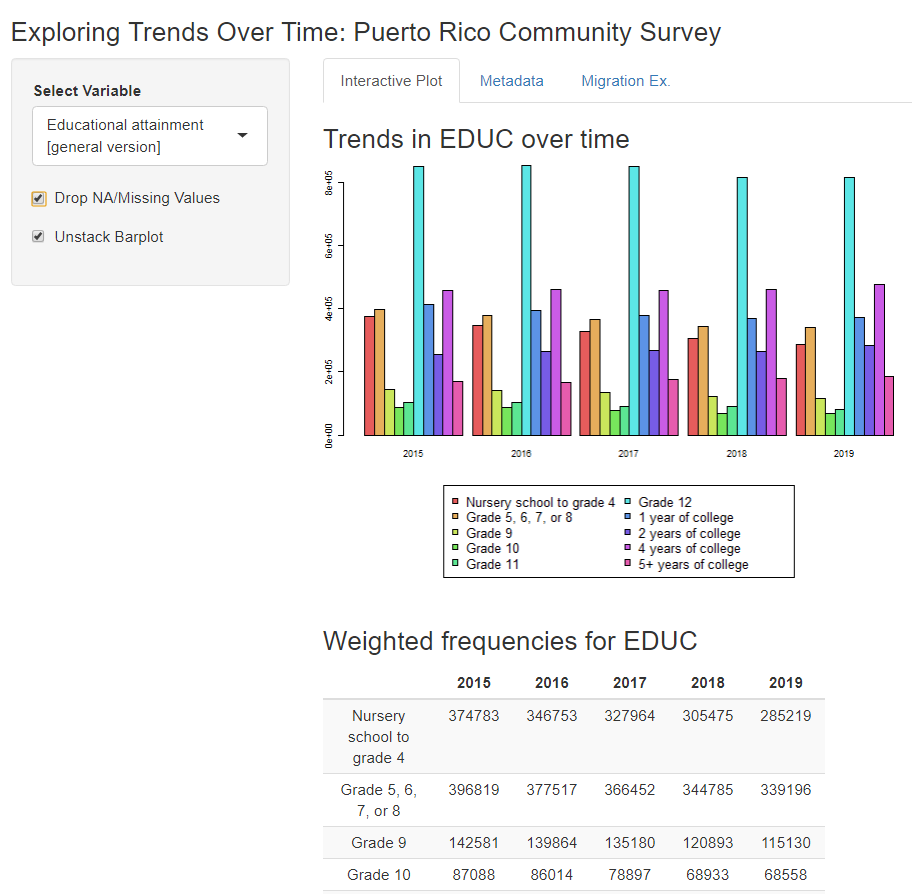
…complete with metadata!
We hope this inspires some cool new uses of IPUMS data, enabled by the IPUMS API. Happy coding and remember,
Use it for Good.
1ipumsr includes a function wait_for_extract() that will periodically check the status of an extract until it finishes processing, but the RRR doesn’t use this function so that it won’t tie up your R session waiting for large extracts to process. (Return to place in blog)