
Research, data preparation, story and graphics by Amalea Jubara and Yaxuan Zhang (Minnesota Population Center, Summer Fellows), mentored by Jonathan Schroeder (IPUMS Research Scientist) and Ying Song (Assistant Professor, Department of Geography, Environment & Society)
Edited by Jonathan Schroeder (IPUMS Research Scientist)
IPUMS NHGIS Block Data: An Expanding Collection
The most spatially precise U.S. census data are block-level tables, summarizing population and housing characteristics for millions of blocks throughout the country. IPUMS NHGIS provides block-level tables for the 1970 to 2010 decennial censuses as well as block boundary files for 1990, 2000 and 2010. This collection is set to grow substantially in the next few years as NHGIS adds new 2020 census block data and as we continue with a major initiative to construct 1980 and 1970 block boundary files. This expansion will open up new possibilities for high-precision spatial analysis across a longer time span.
A Case Study of the Twin Cities’ Black Population
To demonstrate some of the potential value of this expanding collection, we use NHGIS block data, including some not-yet-released 1980 block boundaries, to explore the recent history of racial segregation and integration in the Black population of the Twin Cities of Minneapolis and St. Paul, Minnesota, from 1980 to 2010. We present the block data in an interactive map along with data on early-20th-century racial covenants and the “redlining” zones of the Home Owners’ Loan Corporation (HOLC), recently published by the Mapping Prejudice and Mapping Inequality projects.
The block-level changes since 1980 show a striking trend toward greater dispersion and integration of Black residents, but segregation persists; several neighborhoods still have uniformly low or high proportions of Black residents. By overlaying racial covenants and HOLC zones with the block data, we can also find cases where the historical discriminatory practices appear to have left a lasting imprint on the distribution of Black residents.
Background: Discriminatory Covenants & Zoning
For much of the 20th century, private property covenants, zoning laws, and federal policy shaped spatial segregation patterns throughout the Minneapolis-Saint Paul metropolitan area. Two key types of policies are likely to have significantly contributed to the racial segregation that persists in the Twin Cities: racial covenants and federal mortgage-risk zoning.
In the early 20th century, to restrict the residence and use of properties by race, home sellers attached racial covenants to property deeds using language such as “premises shall not be sold, mortgaged, or leased to or occupied by any person or persons other than members of the caucasian race.” Such covenants were often promoted by property developers as a way to prevent the declines in home value that were common in neighborhoods that added Black residents.
In the 1930s, the Federal Housing Administration (FHA) classified urban residential areas in terms of their lending risk for the HOLC. The program was developed to stabilize housing markets. The HOLC created residential maps that graded the risk of lending to specific neighborhoods in over 200 metropolitan areas across the country. The racial composition of neighborhoods was a major factor in zone classifications.
Areas with a high concentration of certain minority groups, particularly Black people, were assigned a D grade, labeled as “Hazardous,” and colored red; in those areas, the HOLC discouraged the underwriting of loans and investments. Areas colored yellow were graded C and labeled as “Declining,” blue areas were graded B as “Desirable” and green areas were graded A, for the “Best.” Loans for homes in neighborhoods graded A or B were significantly more likely to be underwritten. Because of the red coloring used to indicate “hazardous” neighborhoods, the HOLC grading came to be known as “redlining.”
Redlining and racial covenants were supported by law and worked together, both directly and indirectly, to restrict where Black residents could live in the Twin Cities. The Minnesota Legislature prohibited the use of racial covenants in 1953 whereas open redlining was not made illegal until the 1970s.
Mapping & Exploring the Data
To open the interactive map, click on the image below. The initial view shows the percentage of the 1980 Black population by block, in shades from light yellow to dark blue, for both Minneapolis and St. Paul. This view also shows dark gray outlines around properties that had racial covenants. The covenant data, provided by the Mapping Prejudice project, are limited to Hennepin County, which includes Minneapolis and some of its suburbs, but not St. Paul.
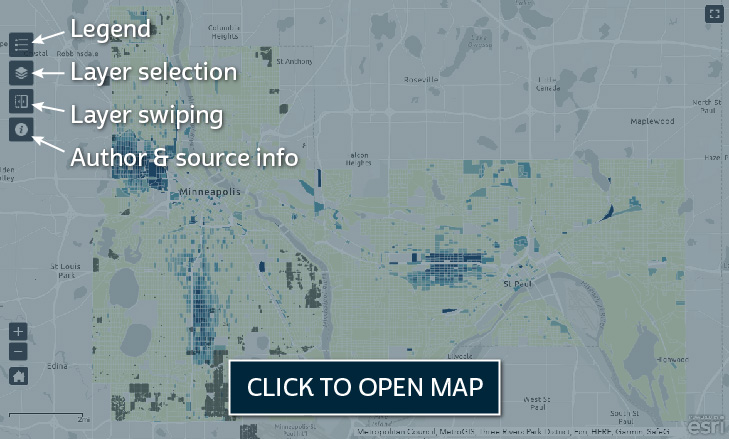
Clicking on a block will pop up a detailed summary of the block’s racial composition along with, for 1980 and 1990 blocks, the median housing value. The icons in the map’s upper left provide access to additional key information and controls. The first icon opens a map legend. The second icon opens a map layer list, providing the option to select which layers are shown. The ordering of layers in the list corresponds to the drawing order; a layer higher in the list will be drawn over the top of any lower layers.
The layer list includes block-level percentages of Black residents for each census year from 1980 to 2010.1 The block boundaries and census data for these layers are all from IPUMS NHGIS. (The newly constructed 1980 boundaries are not yet publicly available.) The layer representing the HOLC zones is from the Mapping Inequality project.
The third icon in the upper left turns on “layer swiping,” which adds a bar to the map that you can drag back and forth to reveal or hide a selected layer. To compare distributions of Black residents in two different years, first make sure that only those two years are selected in the layer list (the second icon); then turn on layer swiping and choose the upper layer (the earlier year) as the “swipe layer.” The map initially has the 1980 and 2010 block layers selected, enabling a comparison of those two years.
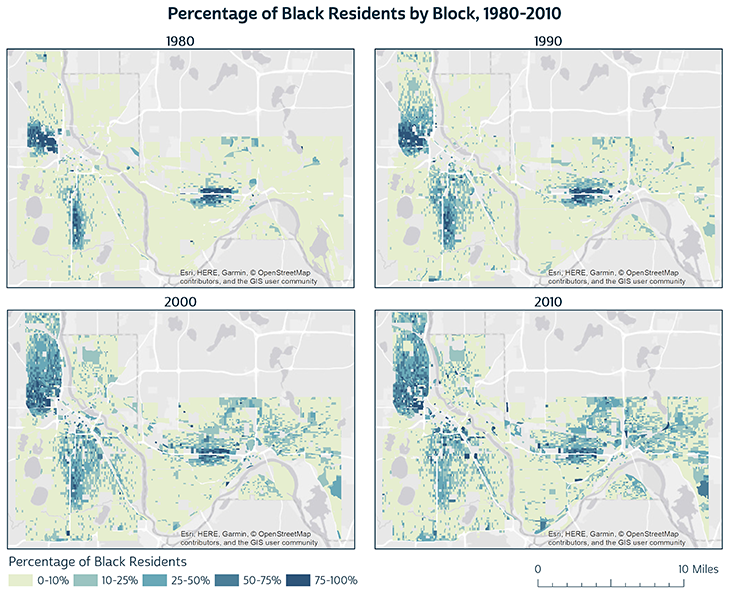
Using the layer swiping with different combinations of block layers is a good way to examine how the distribution of Black residents has changed over time. The image below also provides an overview.
Constrained Dispersion
In 1980, three relatively small areas had large concentrations of Black residents: the Near North and Southside neighborhoods of Minneapolis and the Rondo neighborhood of St. Paul. In the years since, the percentage of Black residents in these neighborhoods declined somewhat as other groups moved into these areas. Elsewhere, many other neighborhoods saw increases in their Black population, especially in North Minneapolis, from the Near North neighborhood up to the city limits; north and east from the Southside; and north and east from the Rondo neighborhood. By 2010, over 40% of inhabited blocks in the cities had at least 10% Black residents, an increase from only 12% of blocks in 1980.
This general trend toward greater dispersion and integration did not penetrate all areas of the cities. After all, if only 40% of blocks had at least 10% Black residents in 2010—at a time when Black residents made up 17% of the cities’ total population—then Black residents remained underrepresented in large portions of the cities. The maps show that there were several sections of the cities where nearly all blocks had low rates of Black residents throughout this period, particularly around the lakes of South Minneapolis and throughout much of southwestern and northwestern Saint Paul.
Lasting Effects of Institutionalized Discrimination?
To what extent might these segregation patterns reflect the continuing effects of the discriminatory covenants and zoning of the past? Since there are many forces that may contribute to persistent segregation, the data presented here do not by themselves allow us to distinguish the significance of the various factors or prove causal linkages.. But the fine-grained spatial detail of block-level data enables us to identify some potential lasting effects based on how block-level racial composition corresponds to the exact boundaries of racial covenants and HOLC zones.
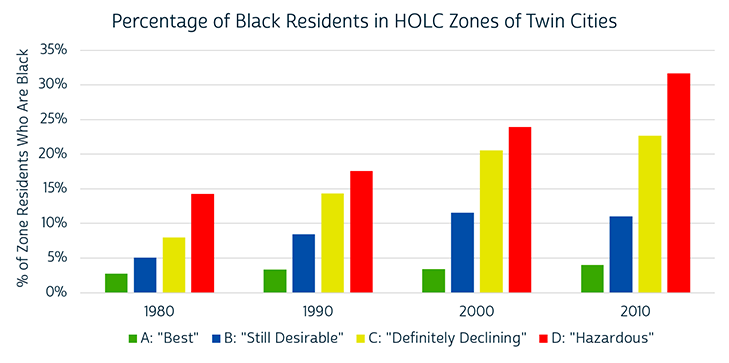
By aggregating the block data, we determined the Black population of each historical HOLC zone in census years from 1980 to 2010. The Twin Cities’ Black population grew in all zone classes throughout this period, but the growth was largely constrained to the lower-rated HOLC zones. While the proportion of Black residents grew by little more than 1 percentage point in A-graded zones and by 6 points in B-graded zones, it grew by 15 percentage points in C-graded zones and 17 points in D-graded zones. The ratio between the percentages in D and A zones also grew from 5.2 in 1980 to 7.9 in 2010. These growing discrepancies may or may not be causally linked to the creation and use of HOLC zones, but there has clearly been substantial persistence—and apparently some amplification—of the neighborhood distinctions that the zones were intended to delineate.
Examining spatial relationships between Black residents and racial covenants similarly produces no hard evidence for causal relationships. In fact, there are a few cases where a block containing large numbers of covenants also had more than 25% Black residents in 1980. More commonly, however, the areas with high concentrations of covenants continued to have low proportions of Black residents through to 2010.
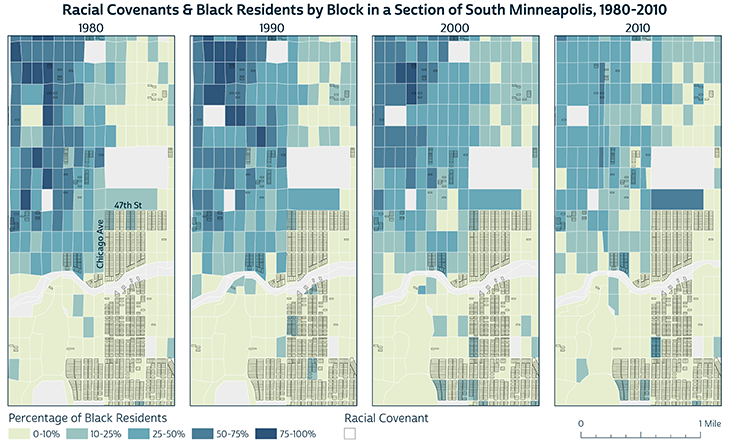
In one case in the Nokomis area of South Minneapolis, illustrated above, the contours of the racial distribution continued to reflect the sharp boundaries of historical covenants for the entire study period. The largest agglomeration of adjacent covenants in Hennepin County stretches southeast from the corner of Chicago Ave and 47th St (exactly nine blocks south of the site of George Floyd’s death). In all census years from 1980 through 2010, the blocks immediately to the north and west of this intersection had substantial proportions of Black residents, but in nearly all blocks to the southeast, the proportions of Black residents remained very low. The covenants here no longer have any legal standing, but the block-level racial distribution at least suggests that their influence lingers on.
New Data, New Windows on Racial Injustice
As NHGIS publishes 1980 and 1970 block boundary data in the coming years, we anticipate the research community will find them a key resource for studying fine-grained spatial dynamics in urban population and housing. Our case study shows that, in conjunction with new data resources provided by the Mapping Prejudice and Mapping Inequality projects, historical block-level data can be especially valuable for investigating long-term trends in racial segregation and the effects of discriminatory housing policies. We look forward to seeing more research using these resources.
1 Two factors complicate direct comparisons of race data across this period. First, since 2000, block-level race data have been subject to some distortion due to “data swapping,” whereby the Census Bureau would swap the characteristics of some households prior to tabulation in order to protect confidentiality. Due to swapping, some blocks that had no Black residents may appear to have some, or vice versa. The Census Bureau also began distinguishing persons of multiple races in 2000. In our maps and data for 2000 and 2010, “Black” refers to individuals who were Black alone, omitting multi-race individuals, some of whom would have been counted as “Black” in previous censuses.
References
Aaronson, D., Hartley, D., & Mazumder, B. (2017). The effects of the 1930s HOLC” redlining” maps (No. 2017-12). Working Paper.
Frey, W. H. (1977). Black movement to the suburbs: potentials and prospects for metropolitan-wide integration (Vol. 77, No. 40). Institute for Research on Poverty, University of Wisconsin.
Iceland, J., & Weinberg, D. H. (2002). Racial and ethnic residential segregation in the United States 1980-2000. Bureau of Census.
Steven Manson, Jonathan Schroeder, David Van Riper, and Steven Ruggles. IPUMS National Historical Geographic Information System: Version 14.0 [Database]. Minneapolis, MN: IPUMS. 2019. http://doi.org/10.18128/D050.V14.0