
By Annie Chen & Sarah Flood
The American Time Use Survey Eating and Health Module, funded by the Economic Research Service, asks a series of questions related to grocery shopping, food preparation, and nutrition. The most recent module was fielded in 2022 during the COVID-19 pandemic and was previously fielded in 2006 to 2008 and 2014 to 2016. The 2022 Eating and Health Module, set to be fielded again in 2023, asks new questions, asks similar questions in different ways than previously fielded modules, and contains additional variables of high interest to researchers.
New Variables in 2022
The 2022 ATUS Eating and Health Module asks a series of new questions related to exercise/physical activity, grocery shopping, meal preparation, and food quality. The food quality questions are especially interesting because they provide researchers with the opportunity to assess relationships between food quality and time use, which hasn’t been possible previously with these data. This is the first time that the ATUS has asked any information about respondents’ food intake on the ATUS diary day. The module is also responsive to changes in shopping behavior during the pandemic, specifically online grocery shopping and grocery delivery/pickup options. The shopping and meal preparation enjoyment questions might allow for comparisons to the ATUS Well-Being Module (fielded in 2010, 2012, 2013, and 2021).
Here’s a list of the new variables in 2022:
- Exercise
- EXINT – Amount of increase in breathing or heart rate due to vigorous exercise/activity
- Food quality
- DIETQUAL – Quality of diet
- Grocery shopping
- GROSHPAMT – Amount of grocery shopping for household
- GROSHPENJOY – Enjoyment level of grocery shopping for household
- ONGROSHPFREQ – Frequency of online grocery purchase
- ONGROSHPGET – Typical online grocery retrieval
- ONGROSHPWHY – Main reason for online grocery shopping
- ONGROSHPWHYNOT – Main reason for not online grocery shopping
- Meal preparation
- FASTFDATE – Ate prepared food yesterday
- PRPMELAMT – Amount of meal preparation in household
- PRPMELENJOY – Amount of enjoyment for meal preparation in household
Variables in 2022 that are Similar to Previous Years
There are three variables new to the 2022 data that are similar to variables available in the earlier modules. While they are similar, they are different enough that we did not harmonize them with the previous variables. The similar pairs of variables are listed in the table below.
| Variable Name | Variable Description | 2006 | 2007 | 2008 | 2014 | 2015 | 2016 | 2022 |
|---|---|---|---|---|---|---|---|---|
| FOODSHOP | ATUS respondent usually does the food shopping | X | X | X | X | X | X | |
| GROSHPAMT | Amount of grocery shopping for household | X | ||||||
| MEALPREP | ATUS respondent usually does the meal preparation | X | X | X | X | X | X | |
| PRPMELAMT | Amount of meal preparation in household | X | ||||||
| FASTFD | Purchased prepared food in last seven days | X | X | X | ||||
| FASTFDATE | Ate prepared food yesterday | X |
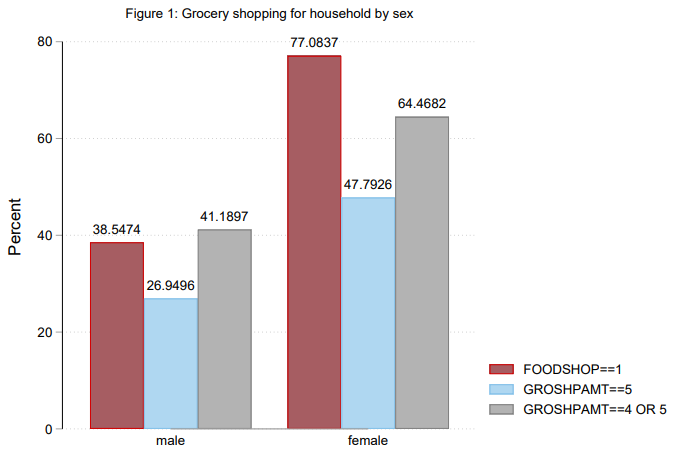
FOODSHOP asks whether the respondent usually does the grocery shopping while GROSHPAMT asks about how much grocery shopping the respondent does. Figure 1 compares estimates from these two variables by gender. It shows the weighted percent of men and women who reported usually doing the food shopping (FOODSHOP) in 2006-2016 versus the percent of men and women who reported doing “all” (GROSHPAMT=5) of the food shopping and “a lot” or “all” (GROSHPAMT=4 or 5) of the food shopping in 2022. (As a reminder, when analyzing variables from the Eating and Health Module, researchers should use EHWT because compared to WT06, EHWT accounts for module non-response.) The more restrictive estimate from 2022 (GROSHPAMT=5) is quite a bit lower than estimates from previous years. But when we include two grocery shopping categories (GROSHPAMT=4 or 5), estimates for 2022 are much closer to the estimates for FOODSHOP suggesting that there is decent comparability between these questions over time. That said, we cannot say whether the difference in estimates is due to gender convergence in grocery shopping or whether the differences are due to respondents being asked different questions.
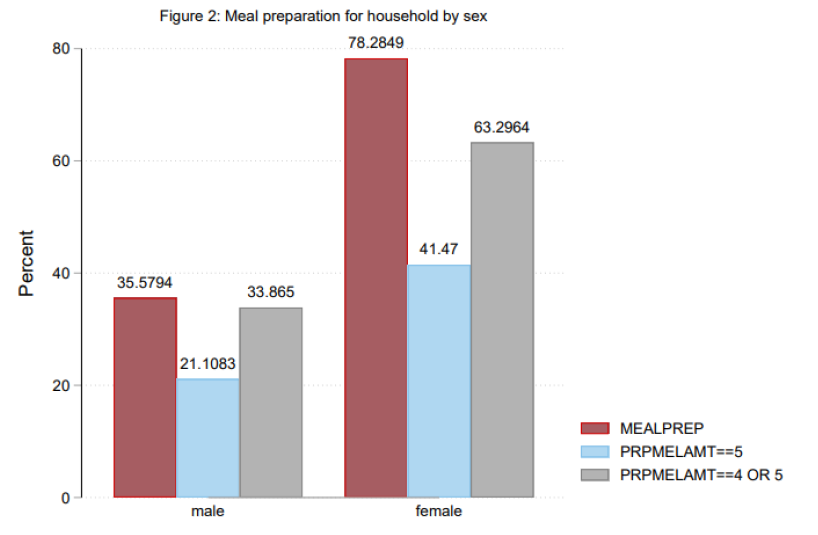
We conducted a parallel analysis for meal preparation, which is shown in Figure 2. These figures compare the weighted percent of men and women who reported usually doing the meal preparation (MEALPREP) in 2006-2016 versus the percent of men and women who reported doing “all” (PRPMELAMT=5) or doing “a lot” or “all” of the meal preparation (PRPMELAMT=4 or 5) in 2022. As we saw for grocery shopping, the percentages of men and women who report doing a lot or all of the meal preparation are reasonably similar across time despite changes in the exact questions asked to respondents.
High Interest Variables from the Eating and Health Module
There were also a set of variables in the 2022 Eating and Health Module that were asked previously relating to general health (GENHEALTH), Body Mass Index (BMI), physical activity (EXERCISE), food security (ENOUGHFD), and eating while engaged in other activities (SED_EAT_LN), in addition to other person-level variables.