 IPUMS-International currently disseminates census microdata from 82 countries around the world. It’s an impressive collection. But it still only covers about half the world’s countries. Under the TerraPop project, we are working to assemble a truly comprehensive global collection of population data.
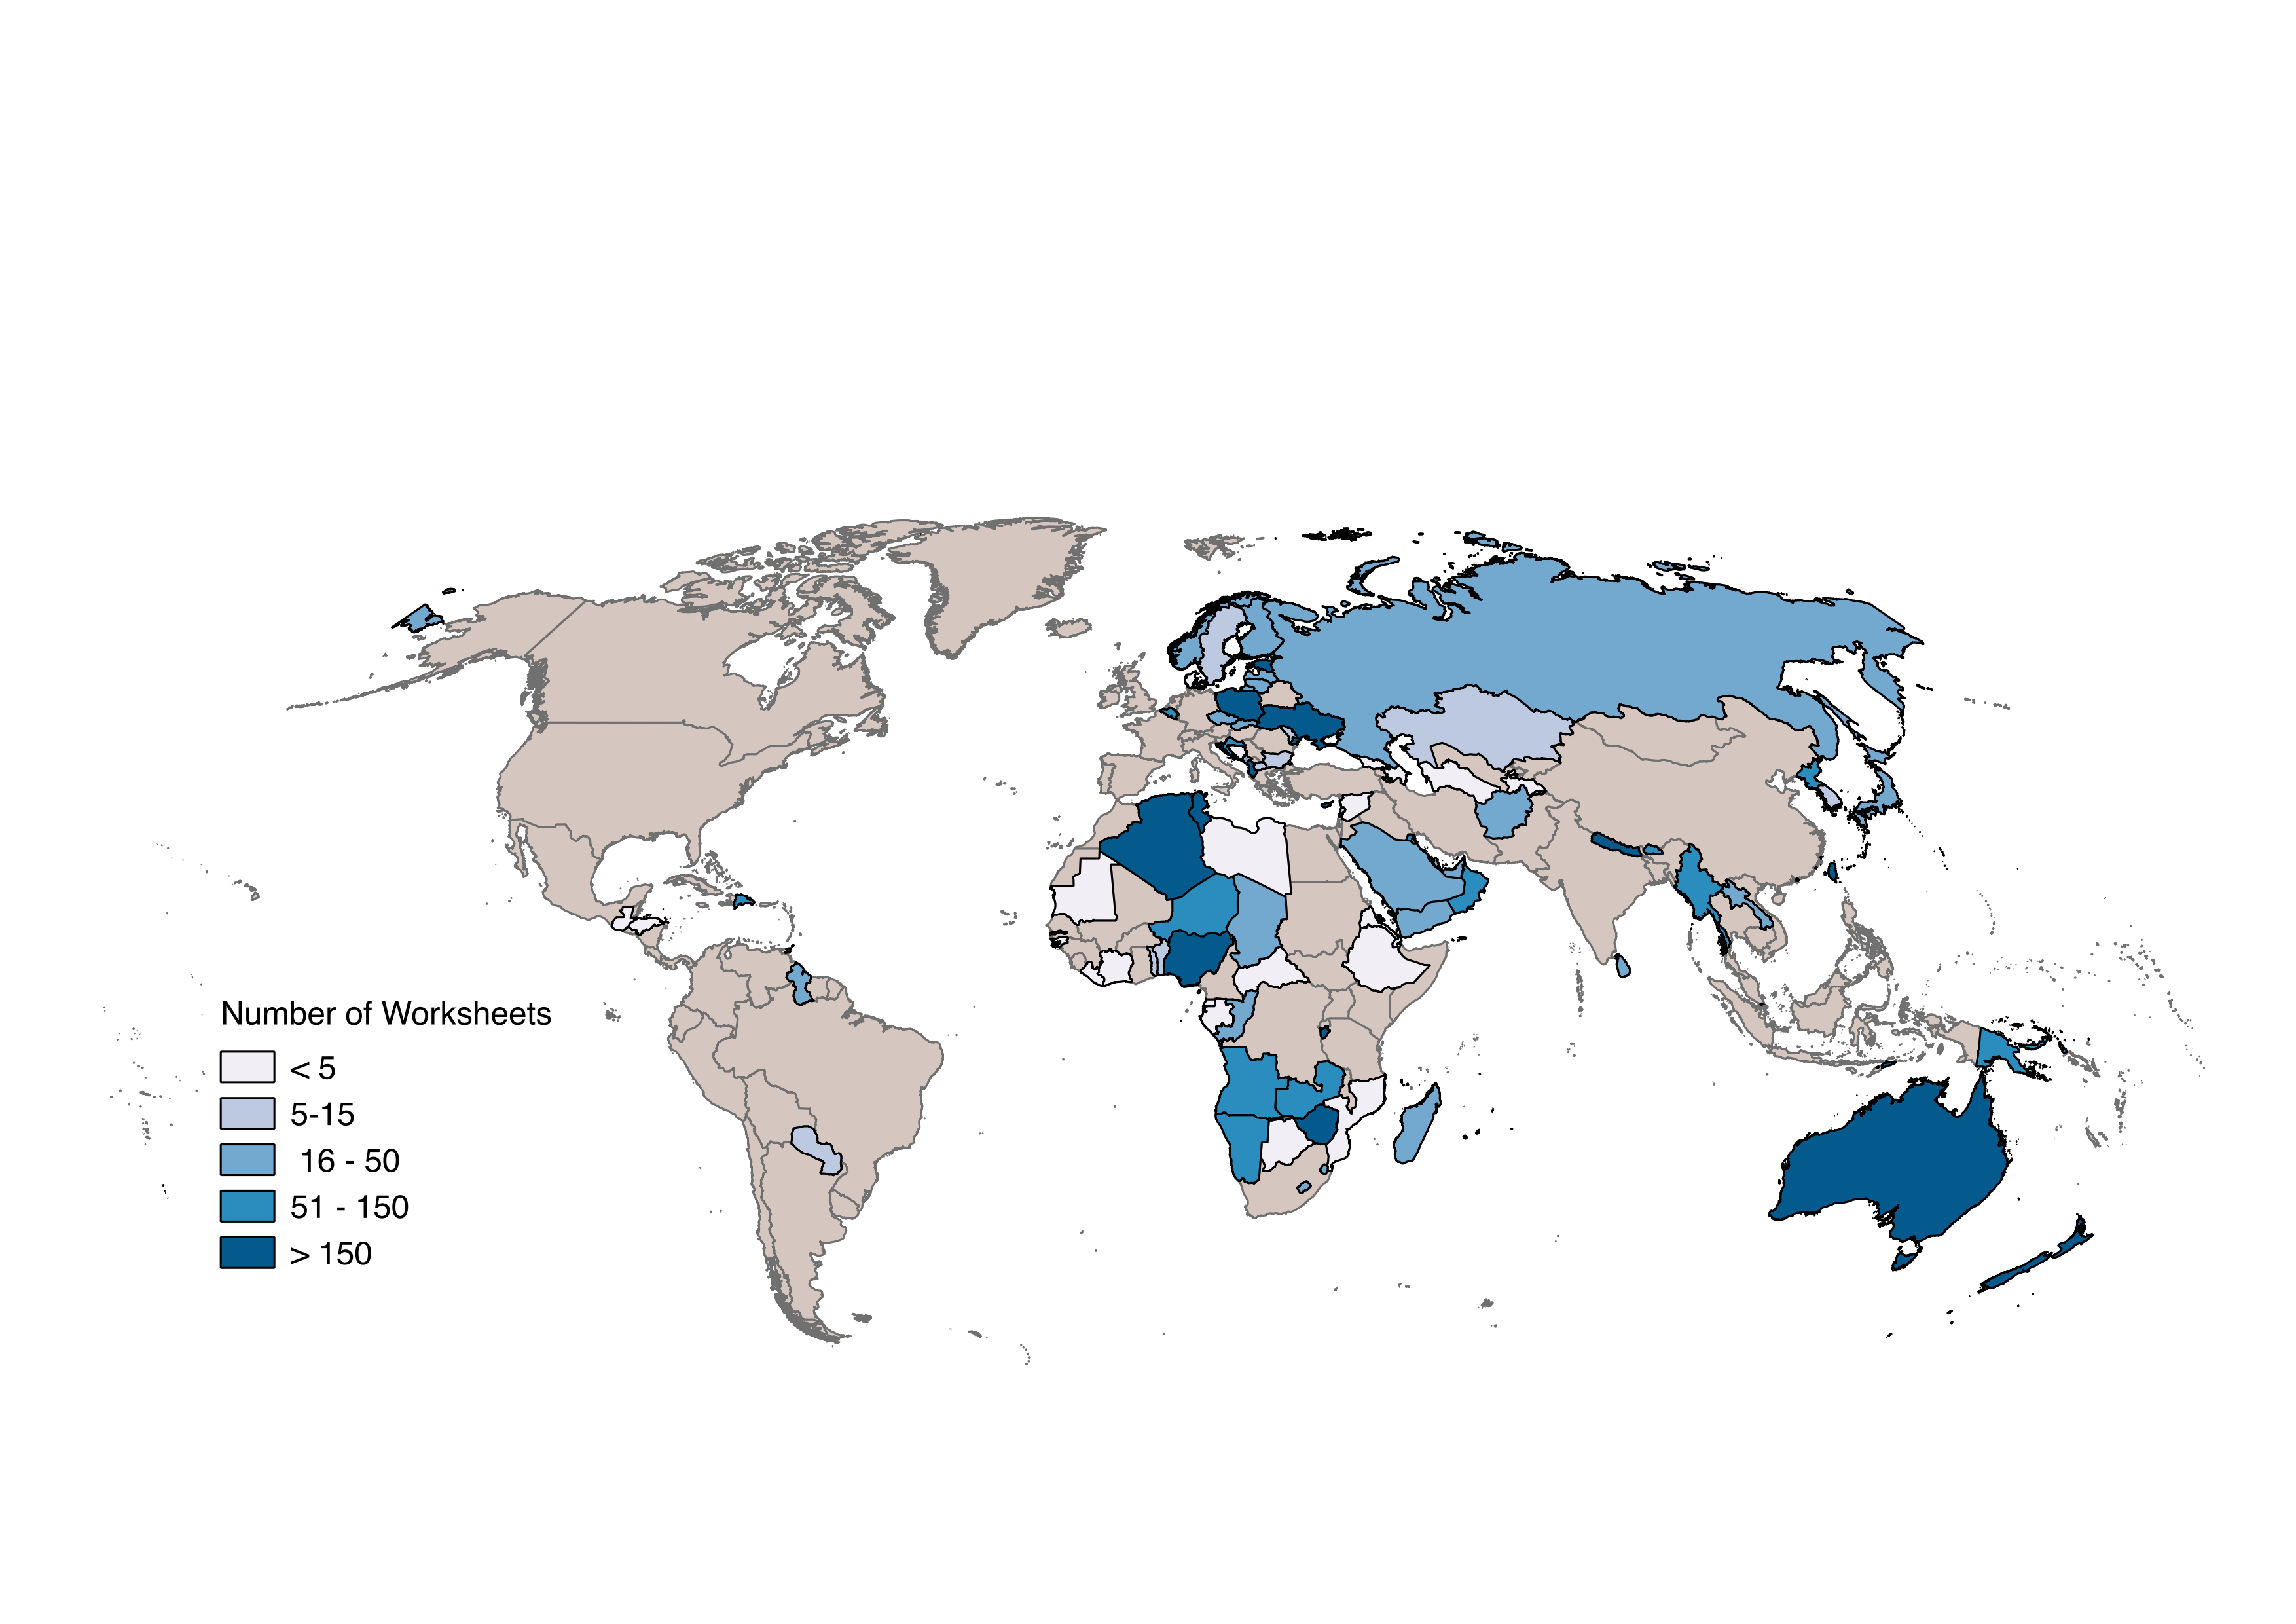
In order to fill in the ninety or so countries not participating in IPUMS-International, TerraPop staff scoured the web sites of national statistical offices for published census tables. Through that effort, we obtained data for 91 countries, most of it in PDF documents. In order to eventually make the data available through the TerraPop web applications, they will need to be ingested into the TerraPop database. Therein lies the challenge. As a first step, we converted tables in the PDF files into MS Excel worksheets. While some countries had only a few tables, for many countries we generated hundreds of Excel worksheets. In total, the collection includes nearly 14,000 worksheets. The tables cover all of the typical census topics, including demographic characteristics, employment, education, migration, social aspects such as language and ethnicity, and housing characteristics.
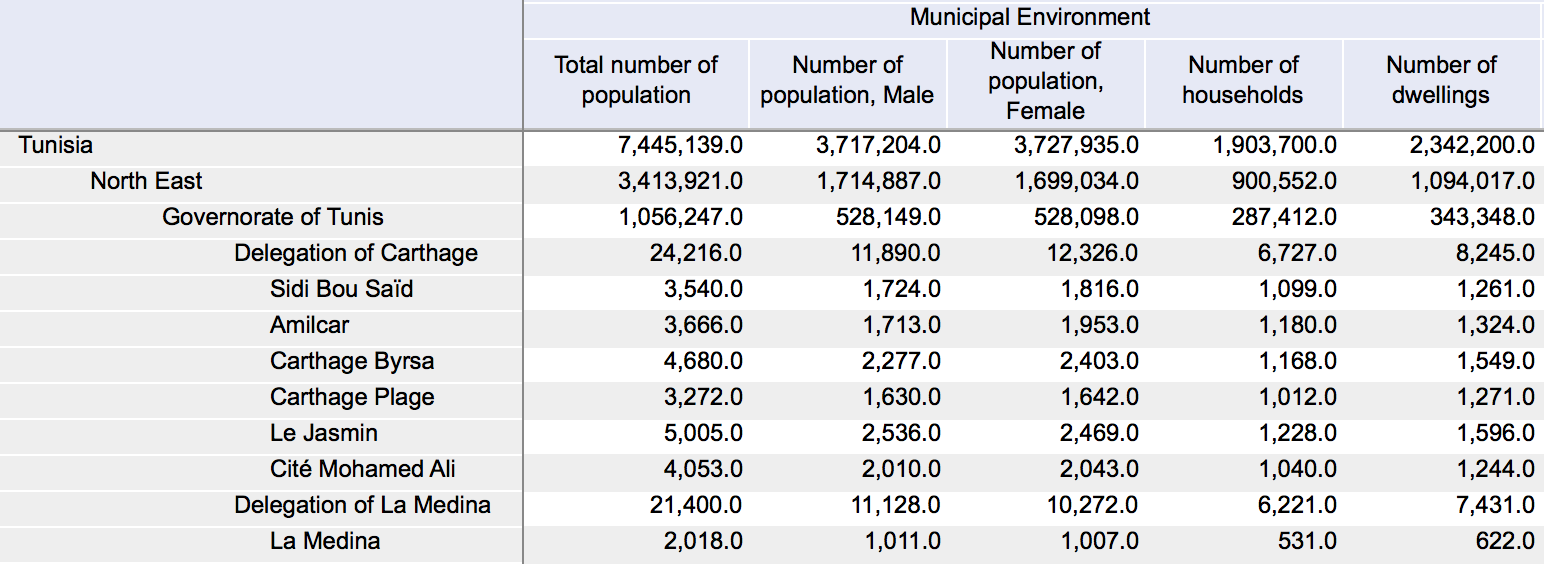
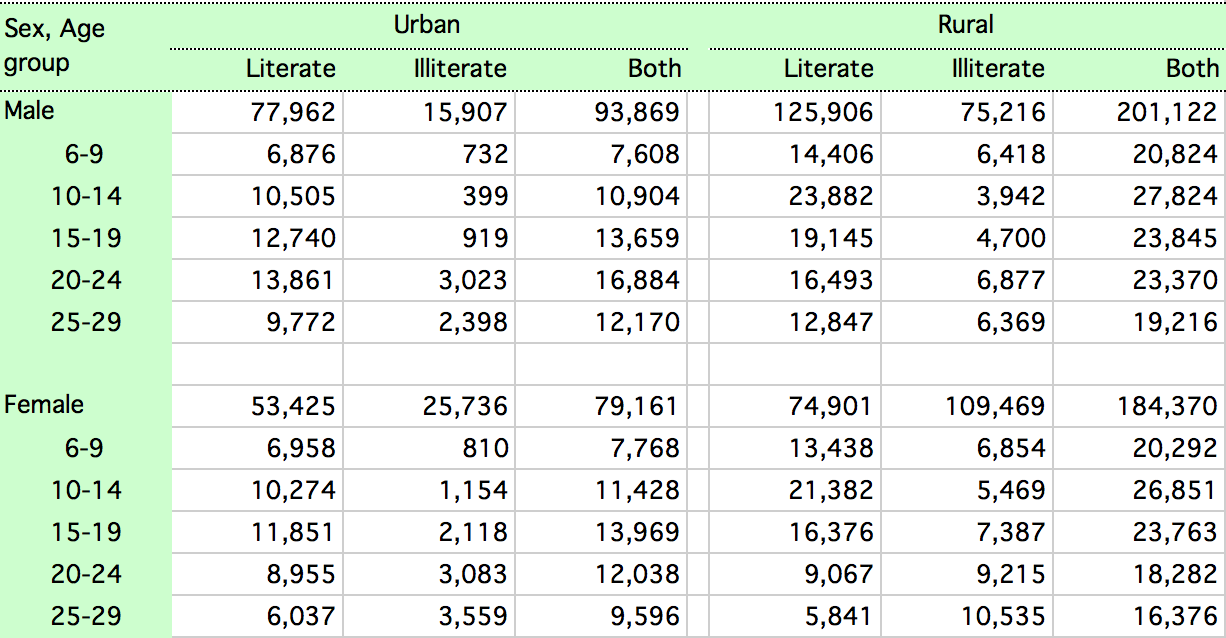
Not surprisingly, every country publishes a unique set of data tables, and there are almost as many ways of structuring and organizing tables as there are countries. In most cases, the contents of each table cell are counts of individuals (or households) in a geographic unit that have some characteristic or combination of characteristics. For example, a table might include counts of males and females with various marital statuses for each district in the country. But such a table could be organized in several different ways. It could have a column for each combination of sex and marital status and a row for each district. Or it could have a column for each marital status and two rows for each district, one containing the number of males and one the number of females. It may or may not include the total numbers of males and females, and/or the totals for each marital status. If districts are sub-divisions of states, it may or may not include state-level totals.
Each table, from all of the many structures, must be transformed into a standard structure to be incorporated into the TerraPop database. In the target structure, the rows are the geographic units for a particular geographic level (e.g., states, counties, or districts), and the columns are counts by categories (e.g., married males, single males, married females, and single females). We are developing processes transform the existing structures into the standard structure. One of the principles guiding our process development is that it should require minimal manual manipulation within Excel. Manual manipulation is time consuming, error prone, and difficult to document, so our goal is to automate as much of the process as possible.
We have identified a handful of table structure families. For example, one family has columns as they would appear in the standard structure, but the rows contain a hierarchy of nested geographic levels. In another family, commonly used for national-level tables, characteristics appear on both the rows and columns. We are developing scripts for each structural family that will automate the transformations required to convert it to the standard structure. Each script is driven by a set of rules that describe specific aspects of a worksheet, such as which row and column headers appear in. To transform a worksheet, an analyst identifies the structural family it belongs to, does some minimal preprocessing of the worksheet (such as unmerging merged cells), creates a rules file based on a template for the structural family, and runs the appropriate script. The rules files have the added benefit of providing a record of the specific manipulations performed for each worksheet.
In addition to producing a CSV file in the standard structure, the scripts also produce metadata files. These files describe the population characteristic categories included in the table and their relationships to each other. One important feature is that relationships between individual categories and totals are captured. For example, if a table included information on married males, married females, and total married persons, the metadata would indicate that the married persons column is a total based on married males and married females. This information can be used to cross-check that the sum of the married males and married females values does, in fact, match the value recorded in the total married persons column.
To date, we have developed scripts for two major structural families and their variations and processed a subset of the tables in those families as a proof of concept. We are seeking funding to develop the remaining scripts and process the vast collection of worksheets to make this rich collection of data available through TerraPop.
Story by Tracy Kugler
