
By Jonathan Schroeder, IPUMS Research Scientist, NHGIS Project Manager
How to make effective bivariate proportional symbol maps
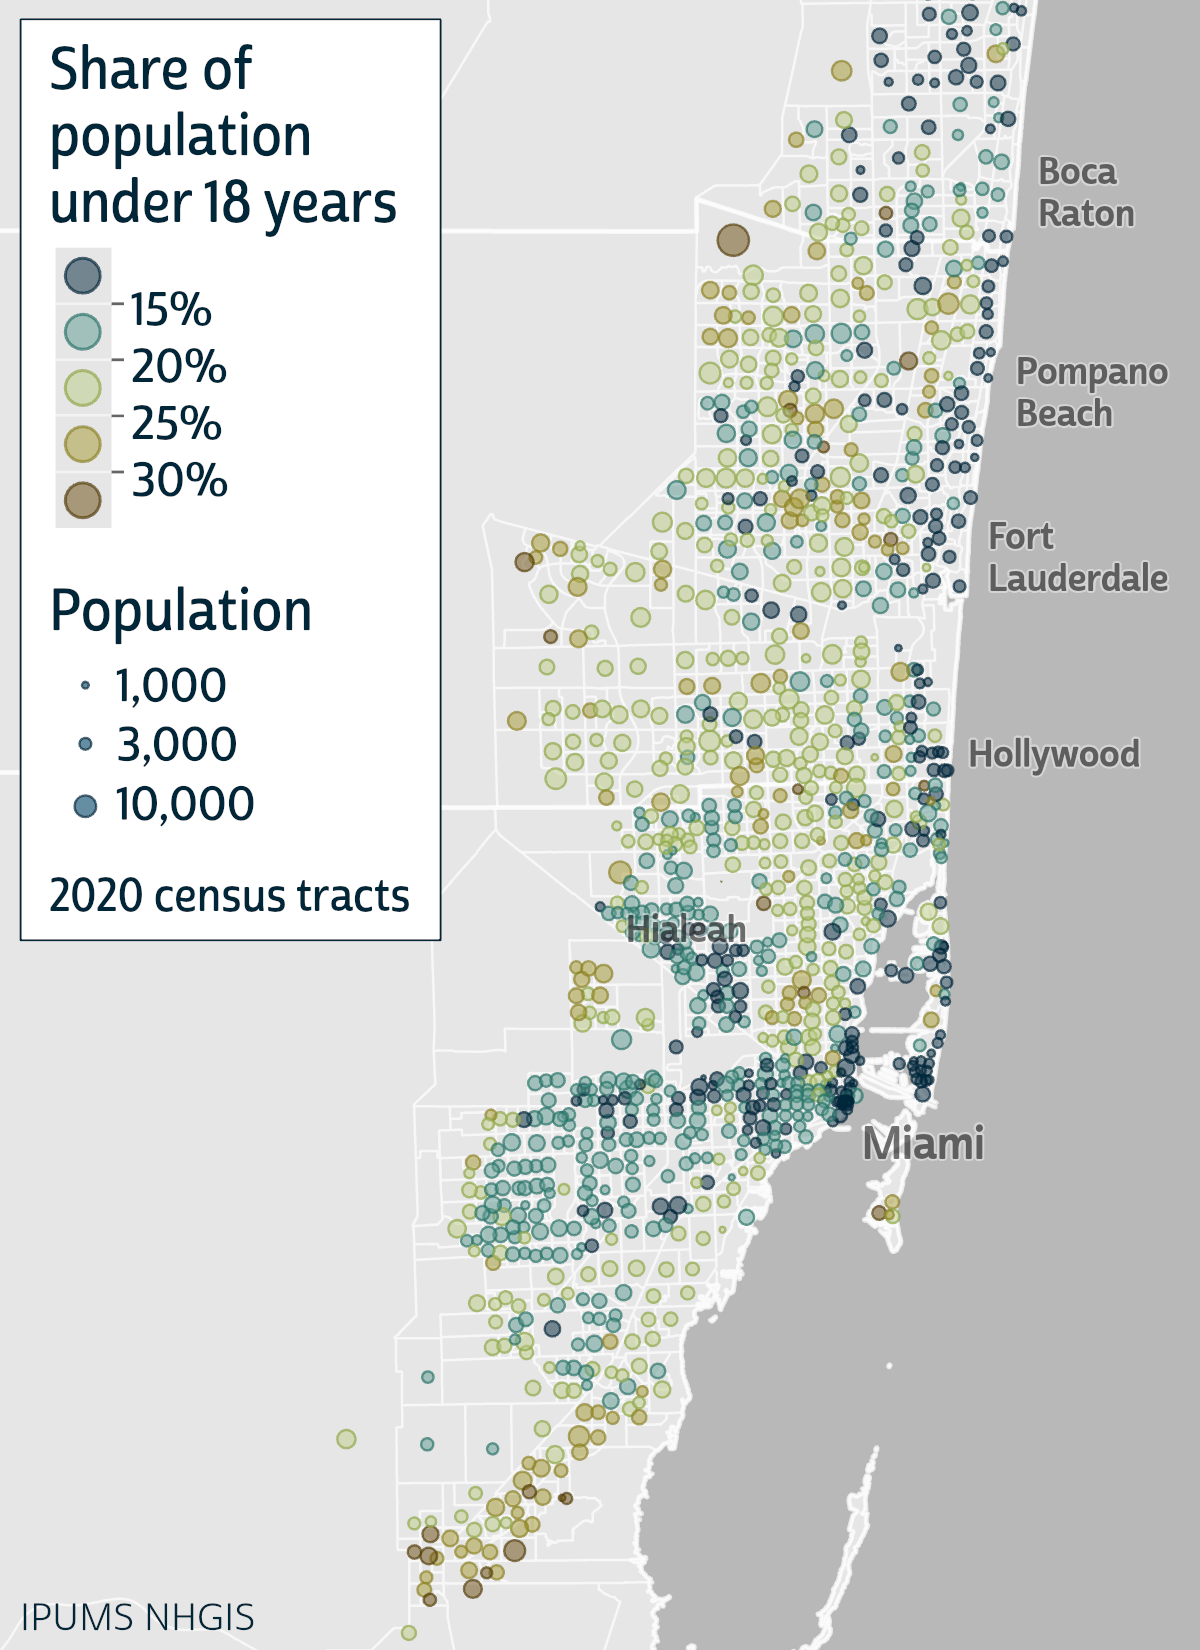
Click map for larger version.
In Part 1 of this blog series, I introduced bivariate proportional symbol maps and shared some examples to demonstrate their advantages. In short, when they’re well designed, they can make it easy to see multiple dimensions of a population all at once: size, composition, and spatial distribution.
A key part of that statement is, “when they’re well designed.” Standard mapping tools can make it easy to get started, but getting all the way to a good design still takes some extra effort.
In this Part 2 post, I discuss some key design considerations for bivariate proportional symbol maps, and I provide specific instructions to help you get to a good design.
Software considerations
I used Esri’s ArcGIS Pro to create the examples here and in Part 1. The design tips I share below should be relevant for any mapping tool, but my instructions are specifically for ArcGIS Pro (version 3.2). I expect there are ways to achieve similar designs with QGIS, R, Python, etc., quite possibly more easily than with ArcGIS Pro. I can only say that it’s easier to create effective bivariate proportional symbols now with ArcGIS Pro than it was with its predecessor ArcMap.
As I proceed, I’ll flag which instructions pertain specifically to ArcGIS Pro. All other tips are “tool neutral.”
General tip: Match size to “size” and color to “character”
When selecting which features to map, a framework that works consistently well is to use symbol color to represent an intensive property—e.g., the share of population under 18 years old, average household size, median household income, or the share of votes cast for a candidate—and use symbol size to represent the number of cases to which the intensive property pertains—e.g., the total population (when color corresponds to a population share) or the count of households (when color corresponds to average household size or median household income).
This framework enables the map to illustrate both the spatial distribution of the mapped characteristics and the frequency distribution of the intensive property—e.g., not only where a candidate received large or small vote shares but also how many votes were cast in each of those areas. Other frameworks can also work well (e.g., see the change maps in Part 1), but it’s generally very helpful if the two mapped characteristics relate to each other in a way that corresponds intuitively with “size” and “color.”
Placement tip: Use centers of population when applicable
For more on this, see my post on census centers of population. This recommendation applies to the common setting where the distribution of the feature of interest corresponds to the population distribution (e.g., housing units, votes cast, consumer sales). For other features (e.g., farm products, land cover, oil wells), placing symbols at area centroids can make more sense.
The value of centers of population also diminishes for states and larger areas, in which case using centers of population can be interesting but also somewhat distracting. States are too large and their populations are internally too widely distributed for their centers of population to greatly improve the representation of the nationwide population distribution.
Currently, NHGIS provides centers of population for states, counties, census tracts, and block groups for 2000, 2010, and 2020. For other areas, you could consider creating population centers yourself using the Census Bureau’s methodology. That said, bivariate proportional symbols can still be effective using whatever placement method your mapping tool makes easiest. The size-color combo maintains its utility even when symbols aren’t optimally placed.
ArcGIS Pro tip: Use “graduated colors” and “vary symbology by size”
ArcGIS Pro offers two routes to make bivariate proportional symbols. I recommend using the second of these:
- Set the primary symbology to proportional symbols and vary the symbology by color.
- Set the primary symbology to graduated colors and vary the symbology by size.
If you take the first route, starting with proportional symbols and adding variation by color, ArcGIS Pro has no built-in support for using graduated colors (e.g., five discrete colors for five data classes). Rather, the color will vary continuously with data values (e.g., slightly different colors for values of 19.1 and 19.2 and very different colors for 10 and 40). This can be an effective method in some settings, but I generally prefer graduated colors, which make it easier for map readers to identify color levels accurately. Another limitation of this first route is that it doesn’t support color variation in outlines, only in symbol fills. (I show why varying outline colors is important below.)
The second route, starting with graduated colors and adding variation by size, doesn’t have these limitations. However, it works only for point layers in ArcGIS Pro. If you select “graduated colors” for a polygon layer, the symbology applies to the polygon fill colors, producing a choropleth map rather than colored point symbols. This is not a problem if you’re starting with centers of population, which will be a point layer in ArcGIS Pro. If you have polygon data and don’t have centers of population, you can use ArcGIS Pro’s Feature To Point tool to generate a point layer from your polygons. If you’d like to show the boundaries of the area units on your map (as I do in my examples), you can use a separate polygon layer with a simple “single symbol” symbology.
To follow the second route, you can start with the basic steps in ArcGIS Pro’s online guides, first to apply graduated colors and then to vary symbol sizes. That said, these instructions will get you only so far. They identify many options for color and sizing and leave the choices up to the user. I’ll provide more guidance on these options in the following sections, starting with size variation.
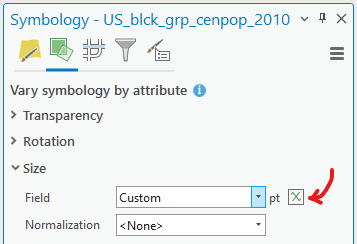
ArcGIS Pro tip: Use an expression to set the symbol size
In the ArcGIS Pro instructions to vary symbology by size, there are a few options in Step 3 for specifying how the symbol sizes will be determined. I recommend the third option, “Write an expression to determine size.” The instructions then provide a little guidance on how to create an expression but no guidance on what the expression should actually be. I’ll walk through that now.
First, to open the Expression Builder, click on the “Set an expression” button…
Don’t worry if you’re not familiar with the default “Arcade” language option. You can use the following example to piece together the key parts of a working expression…
![Expression builder window is open with "arcade" language selected and "$feature['bg_90_20.pop90']" in the Expression field](https://blog.popdata.org/wp-content/uploads/2024/02/expression-builder.png)
At the heart of this expression is $feature[‘bg_90_20.pop90’]. This is the text I used to identify the field corresponding to symbol sizes for my 1990 example in Part 1. Update this with a reference to the field in your data that you’d like the symbol size to represent. To add a field reference into the expression, you can double-click on any of the field names in the list under “Fields”.
Next, apply a square root operation by enclosing the field reference in parentheses preceded by Sqrt (as in the example). ArcGIS Pro uses this expression to set the width of each symbol, but it’s best if the areas of symbols are proportional to the quantity of interest. To achieve that, we just need to set the width to be proportional to the square root of the quantity of interest.
Lastly, to set the scaling of the symbols, divide your expression by a number that produces symbol sizes appropriate for your map (e.g., /20 in the example). ArcGIS Pro sets symbol widths in terms of points. The square root of a population of 10,000 is 100. If you don’t scale this value, it would produce a symbol with a width of 100 points—over an inch wide. Dividing by 20, as in the example, reduces this symbol width from 100 points to 5. My strategy for scaling is to start by dividing the expression by an arbitrary number and then adjust it until symbol sizes are satisfactory overall: as large as possible without forming too many overlaps or obscuring important underlying details. If the symbols seem too large, try using a larger divisor (reducing widths). If the symbols are too small, try using a smaller divisor (increasing widths).
Color tips: Use transparency and vary the outlines
There are many guides available for choosing map color schemes, so I won’t go into detail on that. ArcGIS Pro provides a helpful overview of its built-in options, and ColorBrewer is a great resource for exploring effective alternatives. But there are two additional color considerations that are very important, neither of which are currently well supported by ArcGIS Pro.
If you’ve followed my instructions and tips for ArcGIS Pro thus far, your symbols are appropriately sized and have reasonable color fills, but the remaining default settings could still leave you with a map like the one on the left below: dominated by opaque black outlines, making it very difficult to see color variations among small symbols or in areas of symbol overlap. In principle, there are two easy fixes to this problem, both demonstrated on the right: make the colors semi-transparent, so overlapping symbols are at least partially visible; and vary the outline colors, so the outlines convey information as well as the fills.
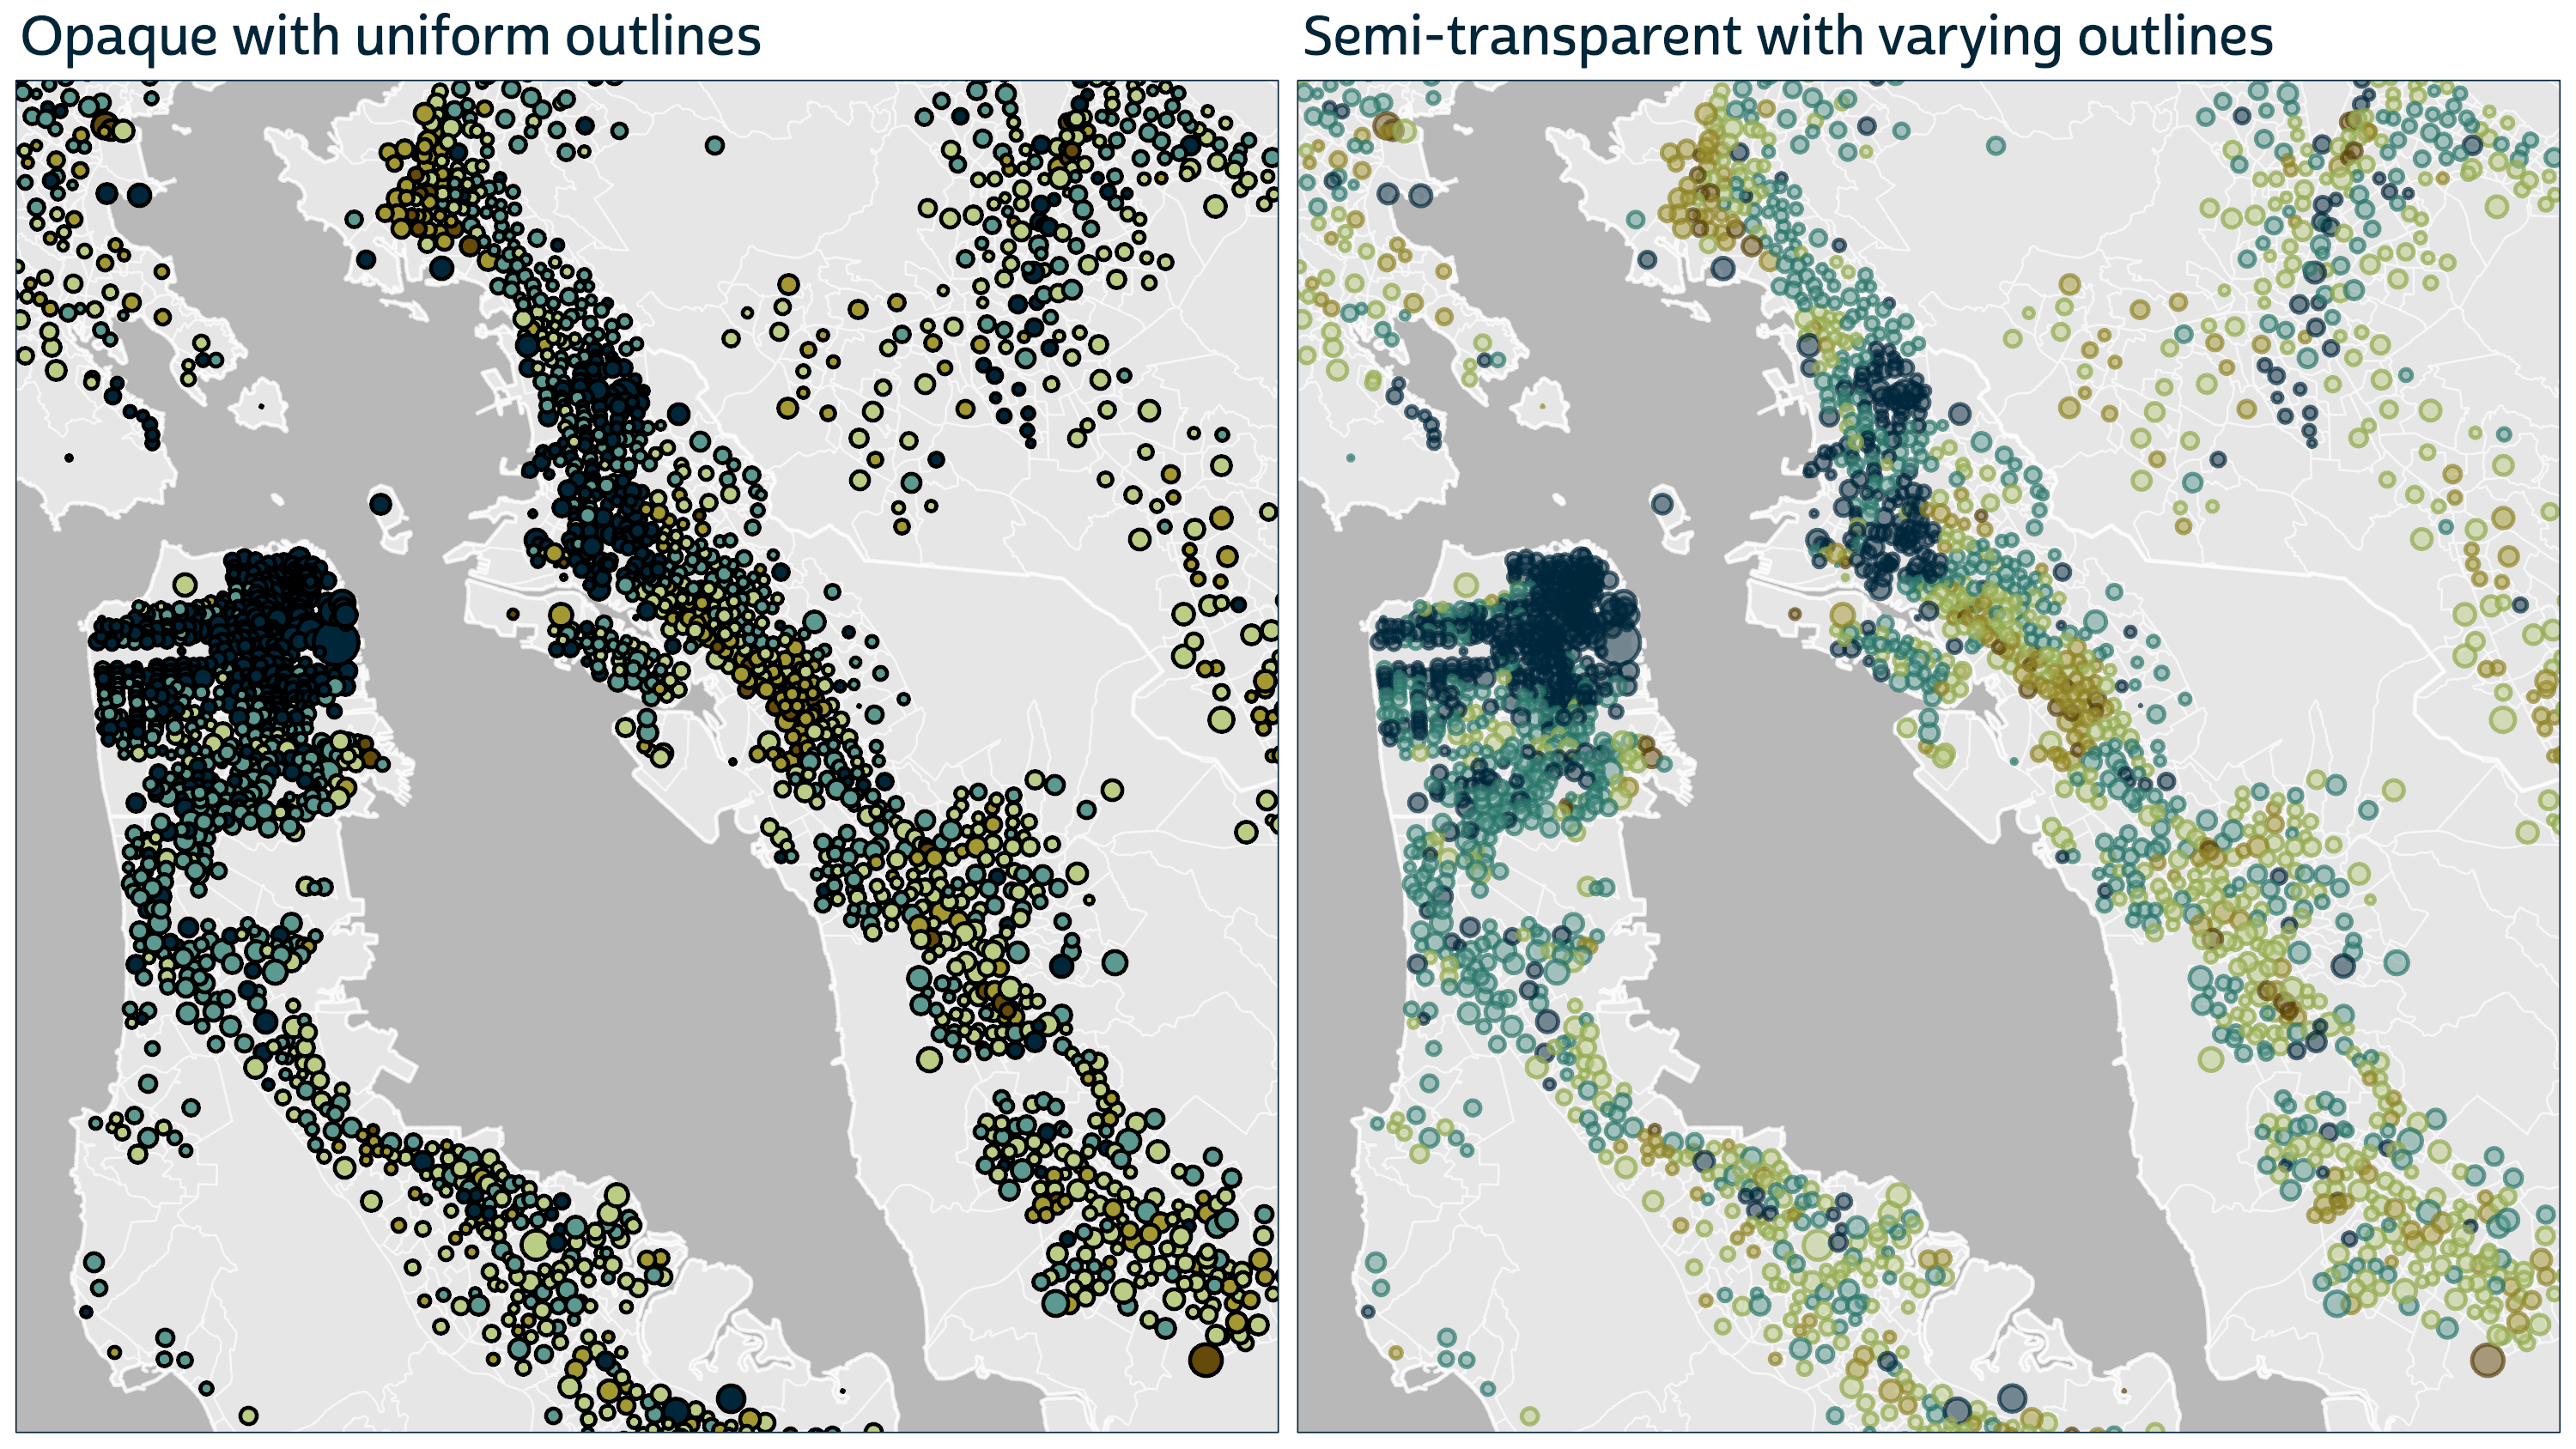
ArcGIS Pro color instructions: I haven’t found a simple high-level solution for these fixes in ArcGIS Pro, but it’s still possible to implement them by making individual adjustments to the fill and outline colors for each color class. The maps above use five color classes, so making the map on the right required ten independent color adjustments, one for each class’s fill and outline. Is it worth the trouble? Comparing the two maps, I definitely think so!
To adjust each symbol’s transparency and outline color, begin by clicking on an example point symbol in ArcGIS Pro’s Contents or Symbology panes. This will open a “Format Point Symbol” pane. Within that, click on Properties and then on the Layers icon, which should bring you to a pane that looks like this:
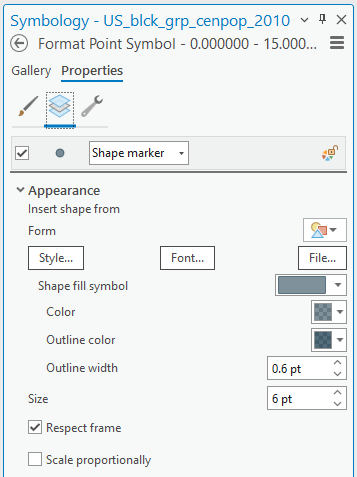
To adjust fill colors, click on the color box next to “Color”, and to adjust outline colors, click on the box for “Outline color”. After clicking on either box, click on Color Properties to open the Color Editor, where you can then make specific adjustments.
For the map examples above, I used transparency values of 50% for fill colors and 33% for outlines. To set outline colors, I first opened the Color Properties for each corresponding fill color, changed the Color Mode to HSV (hue, saturation, value), and recorded the HSV numbers assigned to that fill. Then for each class’s outline, I:
- Set the hue to match the fill hue
- Set the saturation to be somewhat higher than the fill’s (for a purer color)
- Set the value to be somewhat lower than the fill’s (for a darker color)
- Set the transparency to be somewhat lower than the fill’s, as previously noted (to be more opaque).
Note: Before making these individual adjustments, I recommend deselecting the default option to “Scale proportionally” (as seen at the bottom of the above figure). When this option is in effect, the outline widths vary in size along with the whole symbol size, which causes very small symbols to become too small to see. I prefer using a uniform outline width to ensure that at least some color will be visible for any symbol with a nonzero size.
ArcGIS Pro tip: Customize the legend to show useful symbol sizes
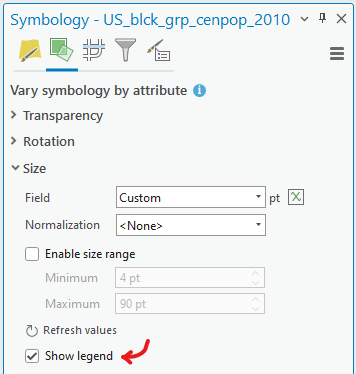
An effective legend for a bivariate proportional symbol map must communicate the meaning of both the colors and sizes of symbols. ArcGIS Pro’s built-in legend utilities work quite well for graduated colors for point symbols, but the options for displaying sizes (when varying graduated-color symbols by size) are more restrictive, making it important to apply custom edits rather than just use the defaults.
Helpfully, you can add symbol sizes to the legend by selecting “Show legend” in the options for the layer’s variation by size:
Then you can follow ArcGIS Pro’s guidance to add a legend to your layout and arrange the legend elements. By default ArcGIS Pro labels symbol sizes in the legend with their actual widths, in points, for an arbitrary set of values (e.g., 6.6091, 13.218, 19.827). To display meaningful values, it seems the only option is to individually adjust both the sizes and labels of the representative symbols in the legend. To achieve this, first convert the legend to graphics and ungroup the legend object. Then you can double-click on individual symbols and labels to adjust their properties.
For the labels, I recommend choosing 3 to 5 round numbers from throughout the distribution of mapped values (e.g., 1,000, 3,000, 10,000). Then you will need to apply your size expression (e.g., the square root divided by 20) to each of those numbers to determine how wide each corresponding legend symbol should be (in points) and adjust their sizes accordingly.
Closing thoughts
I hope this post has provided enough guidance to enable most readers (or at least those who use ArcGIS Pro!) to make more effective, informative maps with bivariate proportional symbols. I’d love to see more of these maps in the future… especially if they’re #poweredbyIPUMS data!
In case you’ve gotten this far and still aren’t sure why I think these maps have so much potential, here again are links to my previous posts that demonstrate their advantages: