The Demographic and Health Survey program is continually collecting and releasing new data; at this writing, nineteen countries are collecting or processing data for standard DHS surveys. Researchers want the latest data for countries of interest, as soon as those data become available. To minimize the wait between the original DHS data release and the release of integrated data, IPUMS DHS is now releasing data multiple times a year.
Data Projects
Researchers Study How Context Affects Health with New IPUMS DHS Variables
Are you interested in how environmental or social contexts affect women’s and children’s health and behavior? IPUMS-DHS now makes it easy to investigate such questions. Using GPS coordinates, we’ve linked contextual variables drawn from many data sources directly to individual DHS respondent records. All context variables describe the features of a small geographic area (5-10 kilometers) surrounding each DHS cluster location.
By doing the technical stuff for you, we’ve freed you up to focus on your important substantive questions—like how climate change influences human health and survival. Our innovation eliminates the need for you to buy or learn geographic software. Even if you’re an ARCGIS whiz, the new IPUMS DHS’ linked data will make your research process simpler and faster.
What new data are available?
Where IPUMS Begins: The 1880 U.S. PUMS

The IPUMS journey to global domination dissemination is being celebrated this summer through an exhibit in the Seminar Room at the Minnesota Population Center.
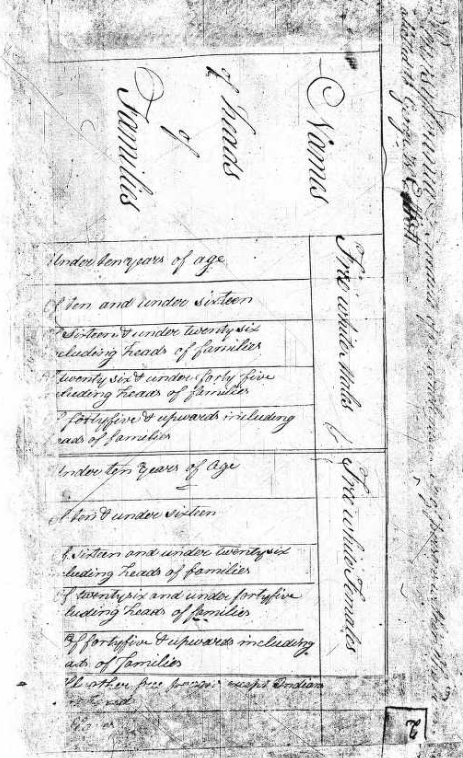
Data Release: U.S. Household-level Full Count Data from 1790-1840

In collaboration with our partners at Ancestry.com, the Minnesota Population Center has released new historical census data through IPUMS-USA. Full count data for 1790-1840 is available via IPUMS-USA as household-level and county-level datasets* for each decennial census year and for the combined years, 1790-1840.
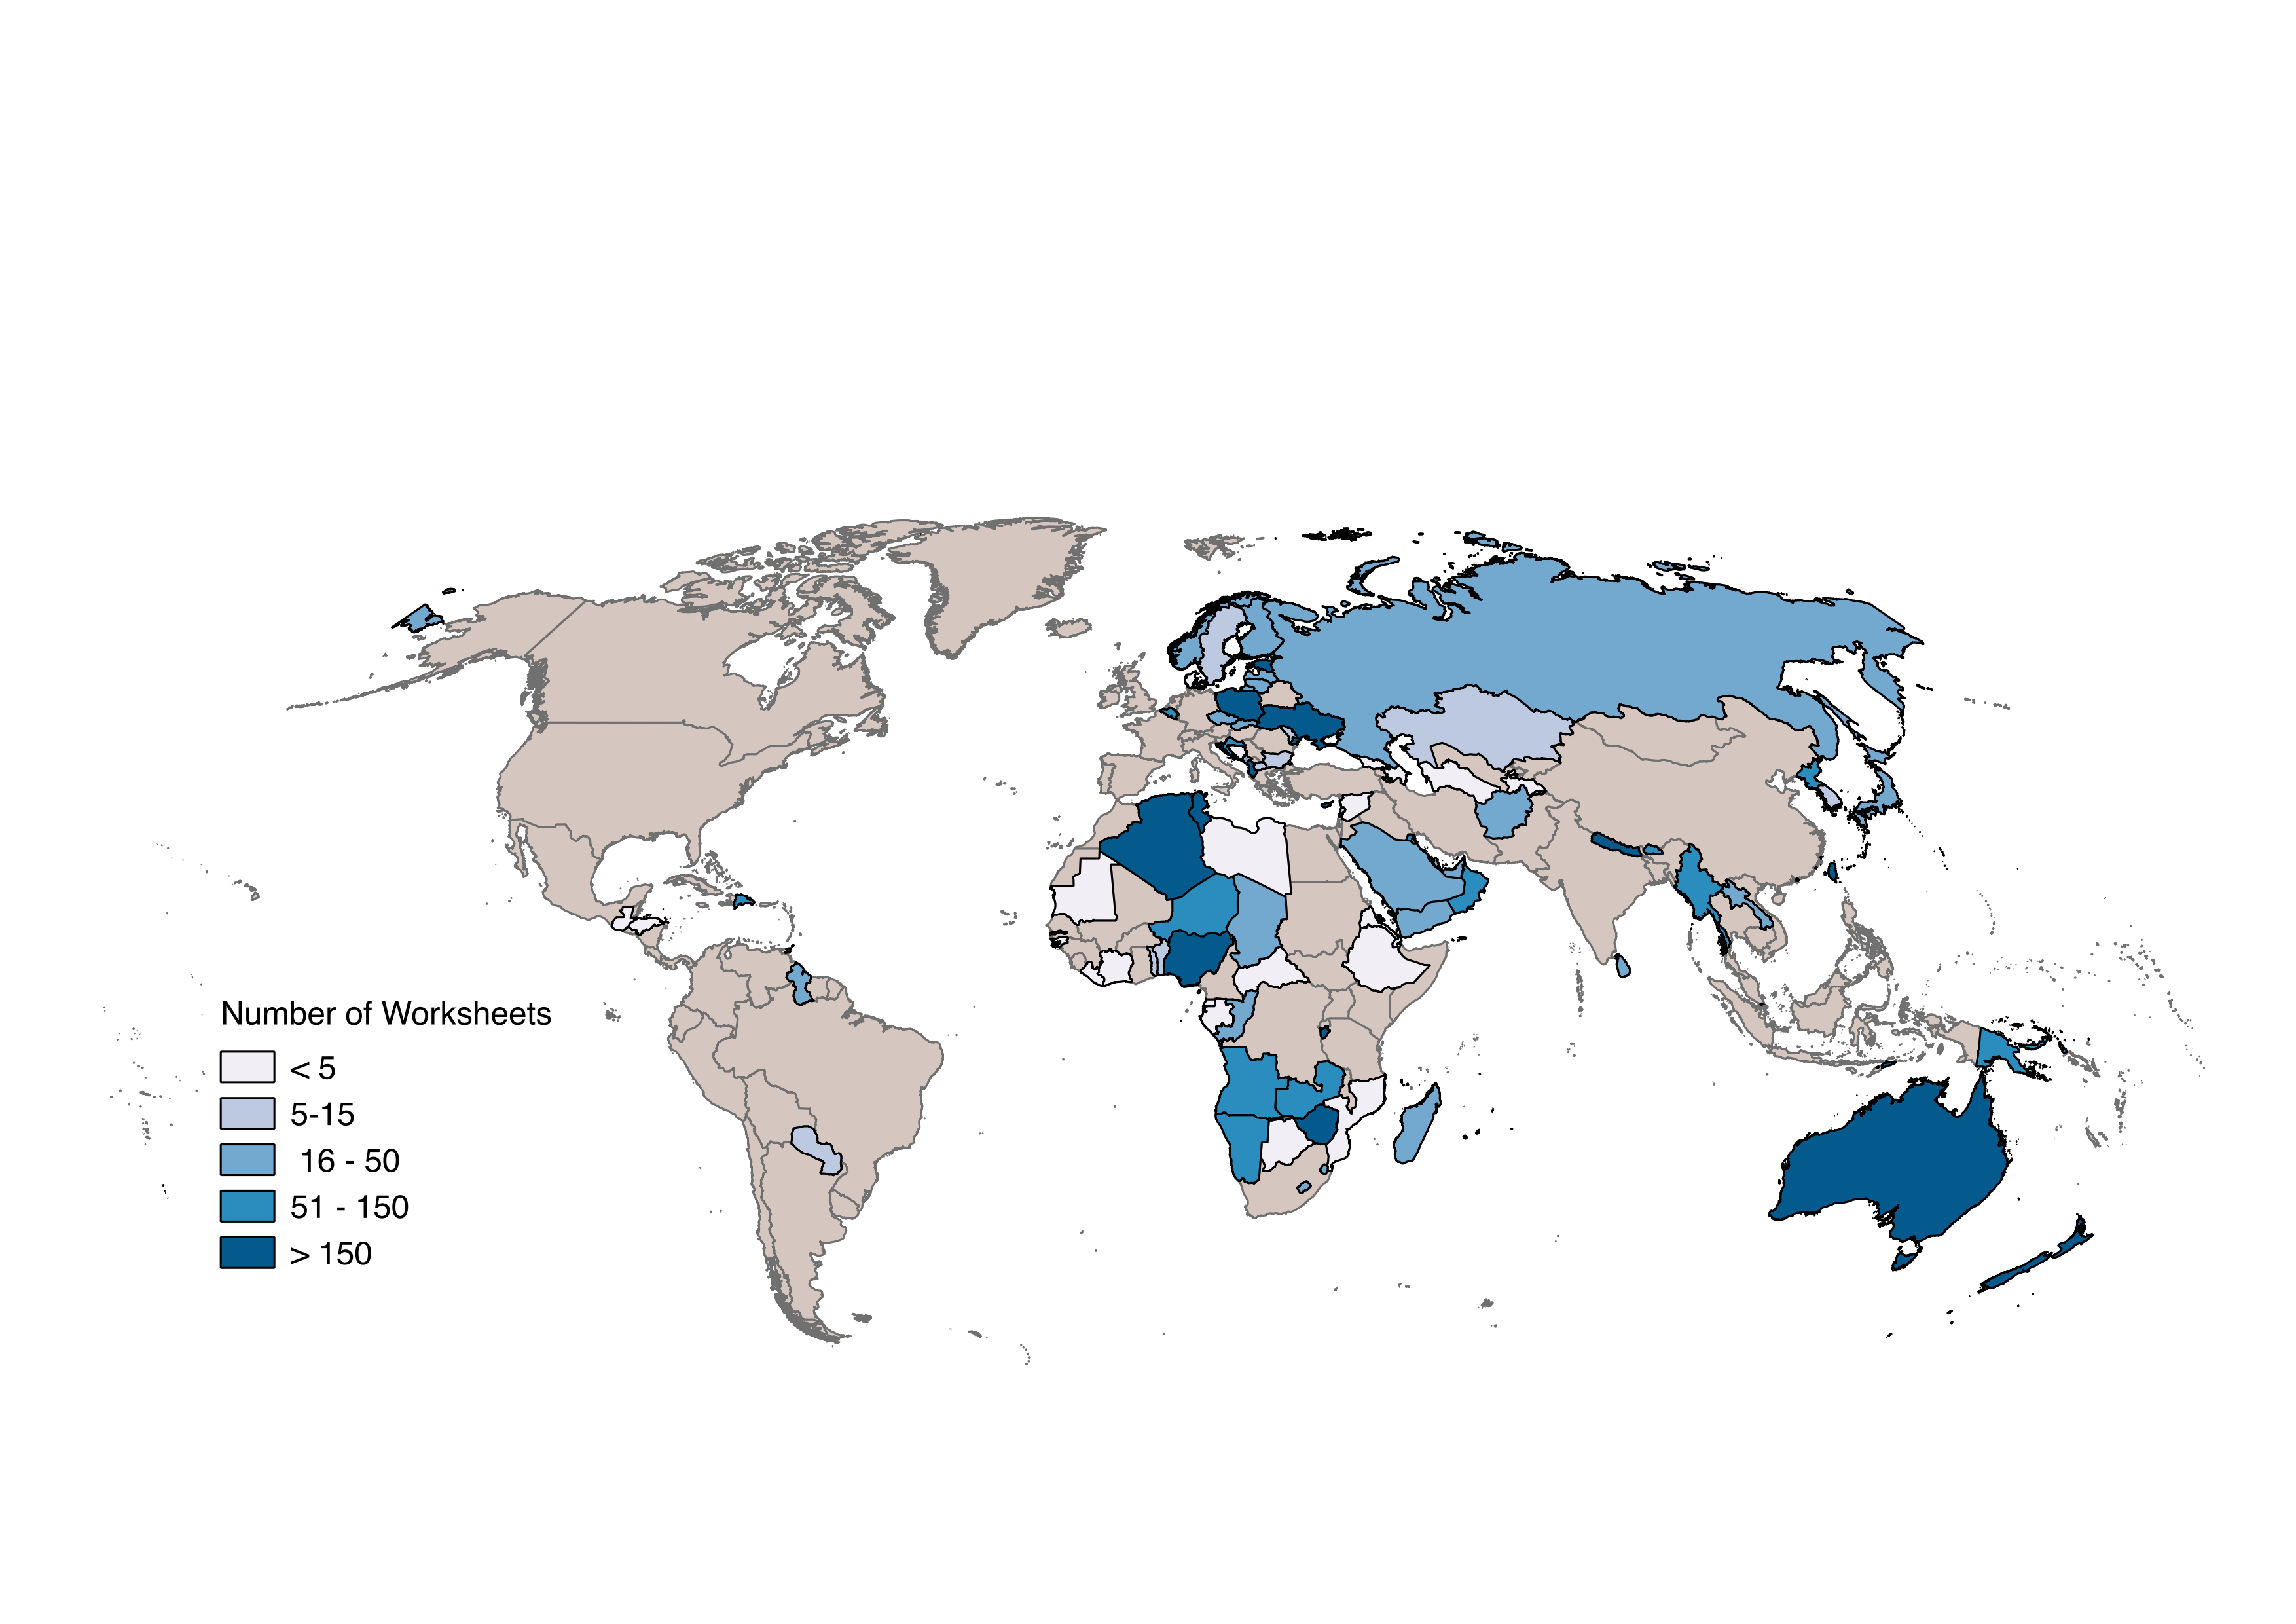
Wrangling International Census Tables
 IPUMS-International currently disseminates census microdata from 82 countries around the world. It’s an impressive collection. But it still only covers about half the world’s countries. Under the TerraPop project, we are working to assemble a truly comprehensive global collection of population data.
Forging New Paths for Adulthood

We all know about what Phyllis Moen calls the linear lockstep life path: first learning, then working for advancement (or at least security), then retirement. What happens when this traditional path no longer fits the realities of most people’s lives?
IPUMS Data Release: 2015 ACS Microdata Now Available

The team at IPUMS-USA is excited to announce the release of the 2015 American Community Survey (ACS) microdata file. IPUMS USA now contains 16 years of yearly ACS microdata for analysis. For researchers, ACS data is the most frequently used IPUMS data.
