
By Diana Magnuson
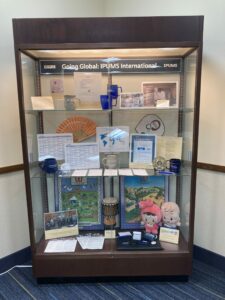
A new exhibit, “Going Global: IPUMS International,” is now on display at IPUMS headquarters, housed at the University of Minnesota. The exhibit features pieces that tell the history and scope of IPUMS International.
Beginning in 1999 with a social science infrastructure grant from the National Science Foundation, IPUMS International had a simple yet audaciously ambitious goal: preserve the world’s microdata resources and democratize access to those resources. Twenty-four years later, the goals are: collecting and preserving census and survey data and documentation; harmonizing those data; and disseminating the harmonized data free of charge. The data series includes information on an impressive range of population characteristics, including fertility, nuptiality, life-course transitions, migration, labor-force participation, occupational structure, education, ethnicity, and household composition.
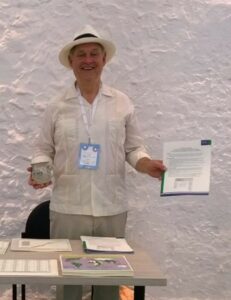
Source data for IPUMS International are generously provided by participating national statistical offices. Our staff develop and nurture relationships with representatives of NSOs from around the world. As IPUMS International got underway, co-principal investigator Dr. Bob McCaa, University of Minnesota Department of History, “proved to have formidable persuasive powers and managed to convince . . . agency directors of the benefits of preservation and access to scientific information.” Over time, IPUMS International developed a team of research scientists articulating to a broad international audience the significance of the IPUMS data collection, harmonization, and preservation work. Today, an NSF advisory committee, senior personnel including research scientists and data analysts, an external advisory panel, and graduate and undergraduate research assistants all support the work of IPUMS International.