
By Tracy Kugler
Nearly all countries throughout the world conduct population and housing censuses at least every ten years, and most also conduct agricultural censuses or surveys regularly. These censuses collect information on demographics, education, employment, housing characteristics, migration, agricultural land ownership, agricultural workforce, livestock, crops, and more. The resulting data can be used to study a wide range of questions, from the character of demographic transitions within and across countries, to utilization of irrigation, to educational trends among women.
Unfortunately, this wealth of data has remained largely inaccessible to researchers. The data are typically published in reports as tables summarizing population characteristics. In recent decades, many of these reports have been published as PDF documents and made available on national statistical office websites. While the reports are available, data from a PDF document cannot be easily imported into a statistical or GIS package. Furthermore, the table structures are highly heterogeneous, both across countries and even within the same report.
The International Historical Geographic Information System (IPUMS IHGIS) is designed to provide easy access to these data in a way that researchers can easily use for analysis. In the early phases, IHGIS was known internally as “Project Mako,” named after the Mako shark, which has a global range, voracious appetite, and a reputation for a broad-ranging diet. Like the shark, IHGIS (née Project Mako) will encompass the world and ingest all kinds of data tables.
IHGIS Data
The initial version of IHGIS includes 270 tables from 9 population and housing censuses and 4 agricultural censuses. We plan to release new datasets several times a year. Our next release will include tables for an additional 12 datasets and is planned for early 2021. We have acquired over 30,000 data tables from 150 population and 107 agricultural censuses from 132 countries, which we will move through the processing pipeline over the next few years.
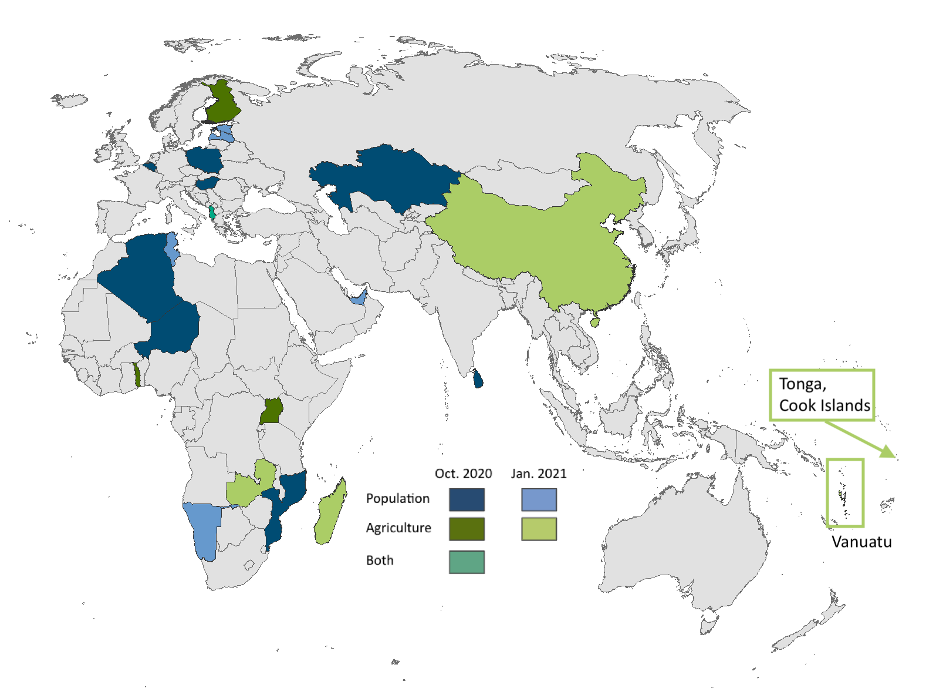
Our data collection efforts for population data have focused primarily on countries for which microdata are not yet available in IPUMS International. The geographic detail available with microdata is often limited due to confidentiality concerns associated with individual-level data. For several countries, notably Canada, Russia, and much of northern Europe, IPUMS International is only able to release first-level (e.g., province) identifiers. Confidentiality concerns are mitigated in summary tables. IHGIS may therefore be able to provide much more geographic detail, and we will focus on acquiring such data in future collection efforts.
You can explore the current collection through the IHIGIS data finder, where you can filter by dataset, browse available tables, select the tables you are interested in, and download the data. Your extract will include consistently structured data tables in CSV format, ready for use in your analysis. You will also receive comprehensive metadata in both human- and machine-readable formats. For more information about how to use the data finder and interpret your extract, check out our User Guide.
IHGIS also provides GIS shapefiles delineating the boundaries of the geographic units described in the data tables. Each unit is identified with a unique code in both the data tables and shapefiles, allowing you to easily join them in a GIS package.
IHGIS Under the Hood
Transforming data tables from the myriad structures in which they are published to the standardized IHGIS structure is no small task. Clearly, it would be impossible without substantial software infrastructure. But it is equally infeasible to completely automate the task of interpreting the contents of any given table. Therefore, the overarching philosophy of IHGIS data processing is to have computers do what computers are good at and have humans do what humans are good at. For example, it is relatively easy for a person to determine whether row headers identify geographic units or categories of marital status or educational attainment. Developing software to make that determination would be a significant challenge. On the other hand, having humans extract state-level totals from a table by copying and pasting is tedious, time-consuming, and error-prone.
The heart of the IHGIS data processing workflow is a table markup framework. Table markup uses Excel as an interface for a lightweight process through which researchers (mostly undergraduate research assistants) indicate the location of key structural elements within each table. For each table, students extract information such as the universe, time frame, and geographic extent. They then add keyword tags indicating the location of geographic unit headers, headers describing the characteristics summarized in the table, the table title, the extent of the data, and other structural elements.
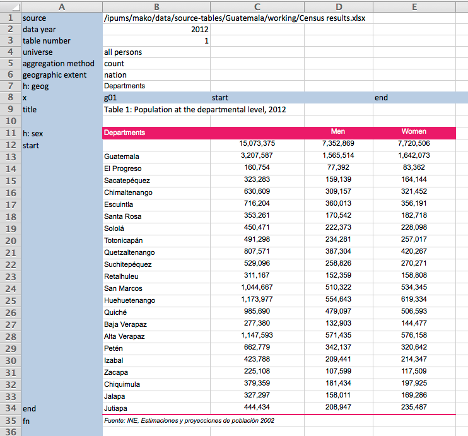
The markup serves as a guide for our software, enabling ingest into a metadata database. The database organizes all row and column headers, titles, universes, and other metadata elements and their relationships in a consistent way. The database, in turn, enables automated restructuring of the data tables to generate the consistently structured tables in IHGIS extracts. For example, many source tables include nested geographic units at two or more levels (e.g., states and counties). IHGIS pulls the appropriate rows apart to create separate files for each level, enabling easier data linkages in GIS packages.
We hope you enjoy using IHGIS, and please send us an email at ipums@umn.edu if you have any questions, comments, or suggestions.