
By Megan Schouweiler (Senior Data Analyst, IPUMS USA) and Sophia Foster (Data Analyst, IPUMS USA)
The Census Bureau drops ACS 1-year PUMS files tomorrow (October 15, 2020)! Don’t worry, the IPUMS USA team will get right to work to get you some data as soon as possible. In the meantime, let’s talk a little about what’s new with occupation and industry variables on IPUMS USA.
New OCCSOC and INDNAICS Crosswalks Available
You may be familiar with our harmonized occupation (OCC1950, OCC1990, OCC2010) and industry variables (IND1950, IND1990). These variables harmonize occupation/industry codes based on Census Bureau classification systems to a base year, making comparisons across time much easier. Researchers are also interested in using the Standard Occupational Classification (SOC) system and North American Industry Classification System (NAICS) codes that are available in the public use data; IPUMS has not created nifty harmonized variables for these codes. We hope to harmonize these codes someday– until then, we will settle for providing great documentation about how these codes have changed over time. And we’ve recently made the documentation even better!
OCCSOC reports the primary occupation based on the SOC system, and INDNAICS reports the type of establishment of the primary occupation based on the NAICS system. Both of these coding systems are periodically updated. In the past two decades, the OCCSOC codes have been updated six times and the INDNAICS codes have been updated five times, creating a challenge for those utilizing the codes to conduct research across time. Beyond navigating the changes to the coding schemes, there are separate crosswalks for each update. We recently updated each of our crosswalks to include all iterations of the underlying coding systems from 2000 onward in a single table for OCCSOC and INDNAICS, respectively. Instead of a bunch of links to crosswalks that just compare adjacent schemes, we’ve combined all years into one table.
In total, we created four crosswalks: OCC to OCCSOC; IND to INDNAICS; OCCSOC only; and INDNAICS only. These crosswalks include detailed descriptions of how OCCSOC and INDNAICS codes have changed over time from the 2000 Census to present. Examples of changes include one occupation/industry splitting into multiple new categories, multiple categories collapsing into one occupation/industry, and updates to codes and titles. Because these types of changes occur with each new iteration of the coding scheme, it can be difficult to understand how the codes relate to one another across time. We hope that these new crosswalks provide a more comprehensive mapping of the OCCSOC and INDNAICS codes over time and will aid researchers in using these variables. These crosswalks are available to view on the IPUMS USA website and for download in both Excel and CSV format. Trust us, you’ll want to download these crosswalks to make your programming a lot easier.
Occupational Standing Variables: What are they good for?
In addition to updating the OCCSOC and INDNAICS crosswalks, IPUMS USA also released the 2018 occupational standing variables for the ACS/PRCS samples. Updated variables include OCCSCORE, SEI, HWSEI, PRENT, PRESGL, EDSCOR50, EDSCOR90, ERSCOR50, ERSCOR90, NPBOSS50, and NPBOSS90. To provide an example of how these variables can be used in research, we conducted a visual analysis using two of the updated variables, ERSCOR50 and EDSCOR50, to examine how occupational standing has changed over time for occupations highlighted during the COVID-19 pandemic.
The COVID-19 pandemic has directed particular attention towards “essential” workers and their contributions to society, raising the question of whether traditional measures of occupational standing reflect the value that we are placing on these “essential” occupations. We examined the occupational standing of occupations that have received popular attention during the COVID-19 pandemic to understand how these occupations compare to one another based on education and earnings, and to see whether these rankings have changed over time from 1950 to 2010 using the decennial Census samples.
We chose these groups from a list of occupations with high exposure to COVID-19 (Lu, 2020) and then narrowed down to a core list of occupations that have been receiving recent media attention.
Table 1: List of Occupations Included in Each Occupation Category
| Occupation Category | Occupations Included in Each Category: |
|---|---|
| Waitstaff | Waiters and Waitresses |
| Cashiers | Cashiers |
| Beauticians | Barbers; Hairdressers, Hair Stylists, and Cosmetologists; Miscellaneous Personal Appearance Workers |
| Nurses | Registered nurses; Nurse anesthetists; Nurse practitioners and nurse midwives; Physician assistants; Medical and health service managers |
| Physicians and Surgeons | Physicians and Surgeons |
| Managers and Officials | Financial analysts; Food service managers; Retail worker supervisors; Producers and Directors; Chief executives and legislators; General and operations managers; Construction managers |
| Teachers | Elementary and Middle School Teachers; Preschool and Kindergarten Teachers; Secondary School Teachers; Education administrators |
| Laborers | Construction Laborers; Refuse and Recyclable Material Collectors; Food Cooking Machine Operators and Tenders; Helpers–Production Workers; Subway, streetcar, and other rail transportation workers |
| Note. This table lists the occupations that are included in each of the eight occupation categories included in the analysis. | |
Next, we matched the occupation titles to the Census defined occupation categories and then to the 1950-equivalent occupation titles using the IPUMS USA variable, OCC1950. To assess occupational standing based on education and earnings, we used EDSCOR50 and ERSCOR50.
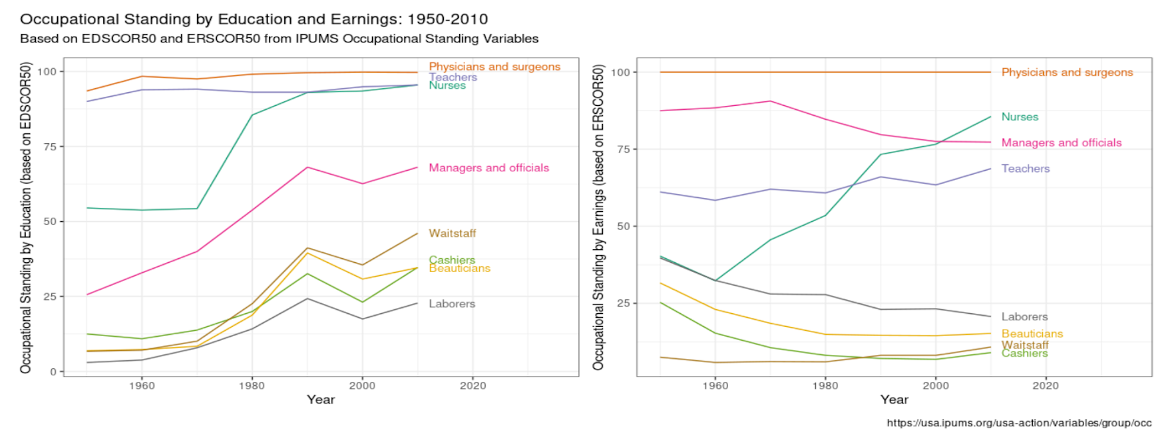
EDSCOR50 is constructed by calculating the percentage of people in a given occupation who have completed one or more years of college. ERSCOR50 is constructed by converting median earnings for each occupation to standardized z-scores, and then converting the z-score to a percent to indicate the percentage of occupations that are above or below a given occupation based on median earnings.
Overall, these figures show that the educational standing of waitstaff, cashiers, beauticians and laborers has been increasing relative to other occupations but their earnings have not. Despite their “essentialness,” examining the occupational standing variables shows that we’ve been compensating these occupations less and less over time.
Our visual analysis is just one of many ways these variables can be utilized for research. We look forward to learning about all the ways our users are leveraging occupational standing measures in their work. And remember… use if for good, never for evil!