 IPUMS is excited to announce the winners of its annual IPUMS Research Awards. These awards honor the best-published research and nominated graduate student papers from 2020 that used IPUMS data to advance or deepen our understanding of social and demographic processes.
IPUMS, developed by and housed at the University of Minnesota, is the world’s largest individual-level population database, providing harmonized data on people in the U.S. and around the world to researchers at no cost.
There are six award categories, and each is tied to the following IPUMS projects:
- IPUMS USA, providing data from the U.S. decennial censuses, the American Community Survey, and IPUMS CPS from 1850 to the present.
- IPUMS International, providing harmonized data contributed by more than 100 international statistical office partners; it currently includes information on 500 million people in more than 200 censuses from around the world, from 1960 forward.
- IPUMS Health Surveys, which makes available the U.S. National Health Interview Survey (NHIS) and the Medical Expenditure Panel Survey (MEPS).
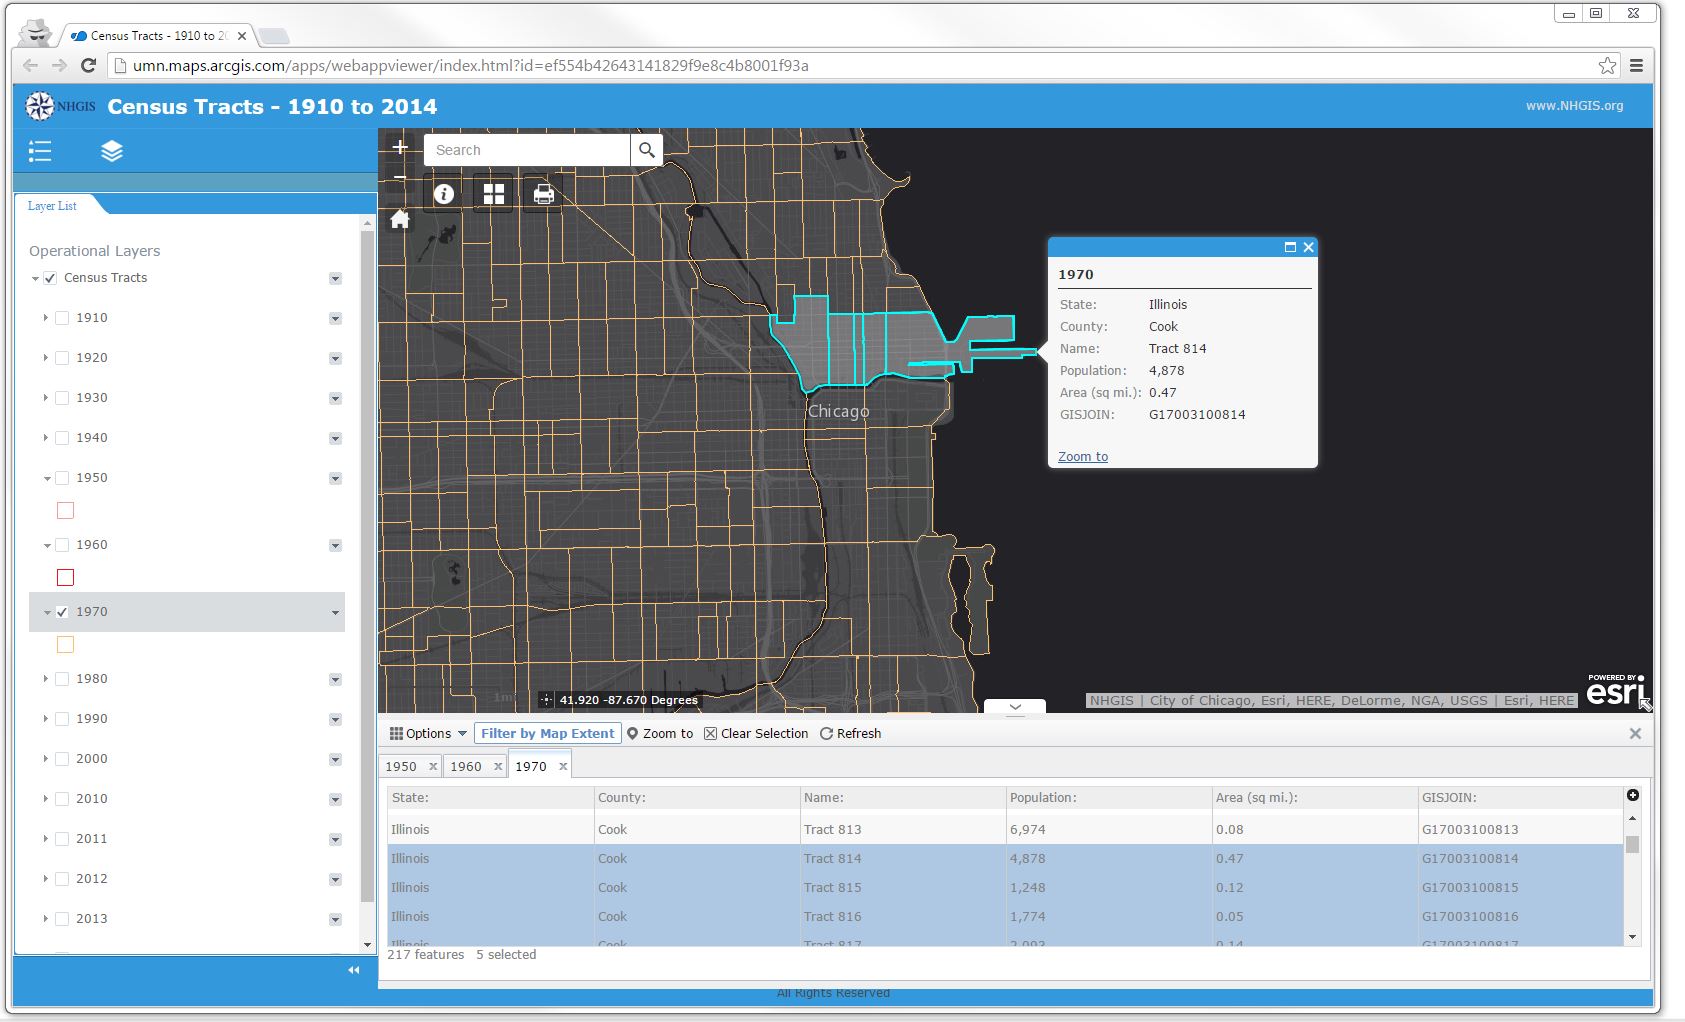
- IPUMS Spatial, covering IPUMS NHGIS and IPUMS Terra. NHGIS includes GIS boundary files from 1790 to the present; Terra provides data on population and the environment from 1960 to the present.
- IPUMS Global Health: providing harmonized data from the Demographic and Health Surveys and the Performance Monitoring and Accountability surveys, for low and middle-income countries from the 1980s to the present.
- IPUMS Time Use, providing time diary data from the U.S. and around the world from 1965 to the present.
Over 2,500 publications based on IPUMS data appeared in journals, magazines, and newspapers worldwide last year. From these publications and from nominated graduate student papers, the award committees selected the 2020 honorees.