By Megan Schouweiler (Senior Data Analyst, IPUMS USA) and Sophia Foster (Data Analyst, IPUMS USA)
The Census Bureau drops ACS 1-year PUMS files tomorrow (October 15, 2020)! Don’t worry, the IPUMS USA team will get right to work to get you some data as soon as possible. In the meantime, let’s talk a little about what’s new with occupation and industry variables on IPUMS USA.
New OCCSOC and INDNAICS Crosswalks Available
You may be familiar with our harmonized occupation (OCC1950, OCC1990, OCC2010) and industry variables (IND1950, IND1990). These variables harmonize occupation/industry codes based on Census Bureau classification systems to a base year, making comparisons across time much easier. Researchers are also interested in using the Standard Occupational Classification (SOC) system and North American Industry Classification System (NAICS) codes that are available in the public use data; IPUMS has not created nifty harmonized variables for these codes. We hope to harmonize these codes someday– until then, we will settle for providing great documentation about how these codes have changed over time. And we’ve recently made the documentation even better!
OCCSOC reports the primary occupation based on the SOC system, and INDNAICS reports the type of establishment of the primary occupation based on the NAICS system. Both of these coding systems are periodically updated. In the past two decades, the OCCSOC codes have been updated six times and the INDNAICS codes have been updated five times, creating a challenge for those utilizing the codes to conduct research across time. Beyond navigating the changes to the coding schemes, there are separate crosswalks for each update. We recently updated each of our crosswalks to include all iterations of the underlying coding systems from 2000 onward in a single table for OCCSOC and INDNAICS, respectively. Instead of a bunch of links to crosswalks that just compare adjacent schemes, we’ve combined all years into one table.
In total, we created four crosswalks: OCC to OCCSOC; IND to INDNAICS; OCCSOC only; and INDNAICS only. These crosswalks include detailed descriptions of how OCCSOC and INDNAICS codes have changed over time from the 2000 Census to present. Examples of changes include one occupation/industry splitting into multiple new categories, multiple categories collapsing into one occupation/industry, and updates to codes and titles. Because these types of changes occur with each new iteration of the coding scheme, it can be difficult to understand how the codes relate to one another across time. We hope that these new crosswalks provide a more comprehensive mapping of the OCCSOC and INDNAICS codes over time and will aid researchers in using these variables. These crosswalks are available to view on the IPUMS USA website and for download in both Excel and CSV format. Trust us, you’ll want to download these crosswalks to make your programming a lot easier.
Continue reading…

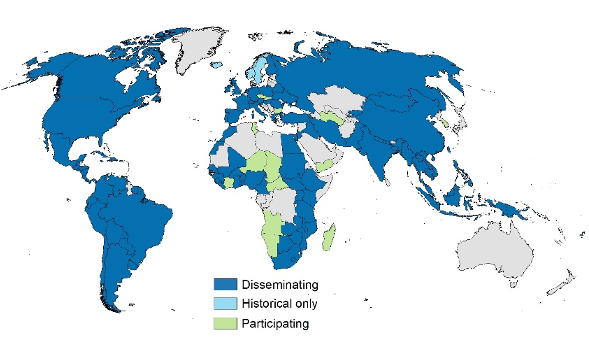 IPUMS International has added 19 new census samples and new labor force surveys. First-time data release countries include four new countries from four different continents—Finland, Mauritius, Myanmar, and Suriname. Other newly added samples extend pre-existing series. Another first is the addition of labor force surveys from Spain and Italy. See a summary of the full IPUMS collection on the IPUMSI samples page.