Geospatial Contextuals from IPUMS International

By Ryan Gavin & Quinn Heimann

IPUMS International launched a new platform that will aid researchers using geospatial contextual data along with IPUMS International census microdata!

What is geospatial contextual data?

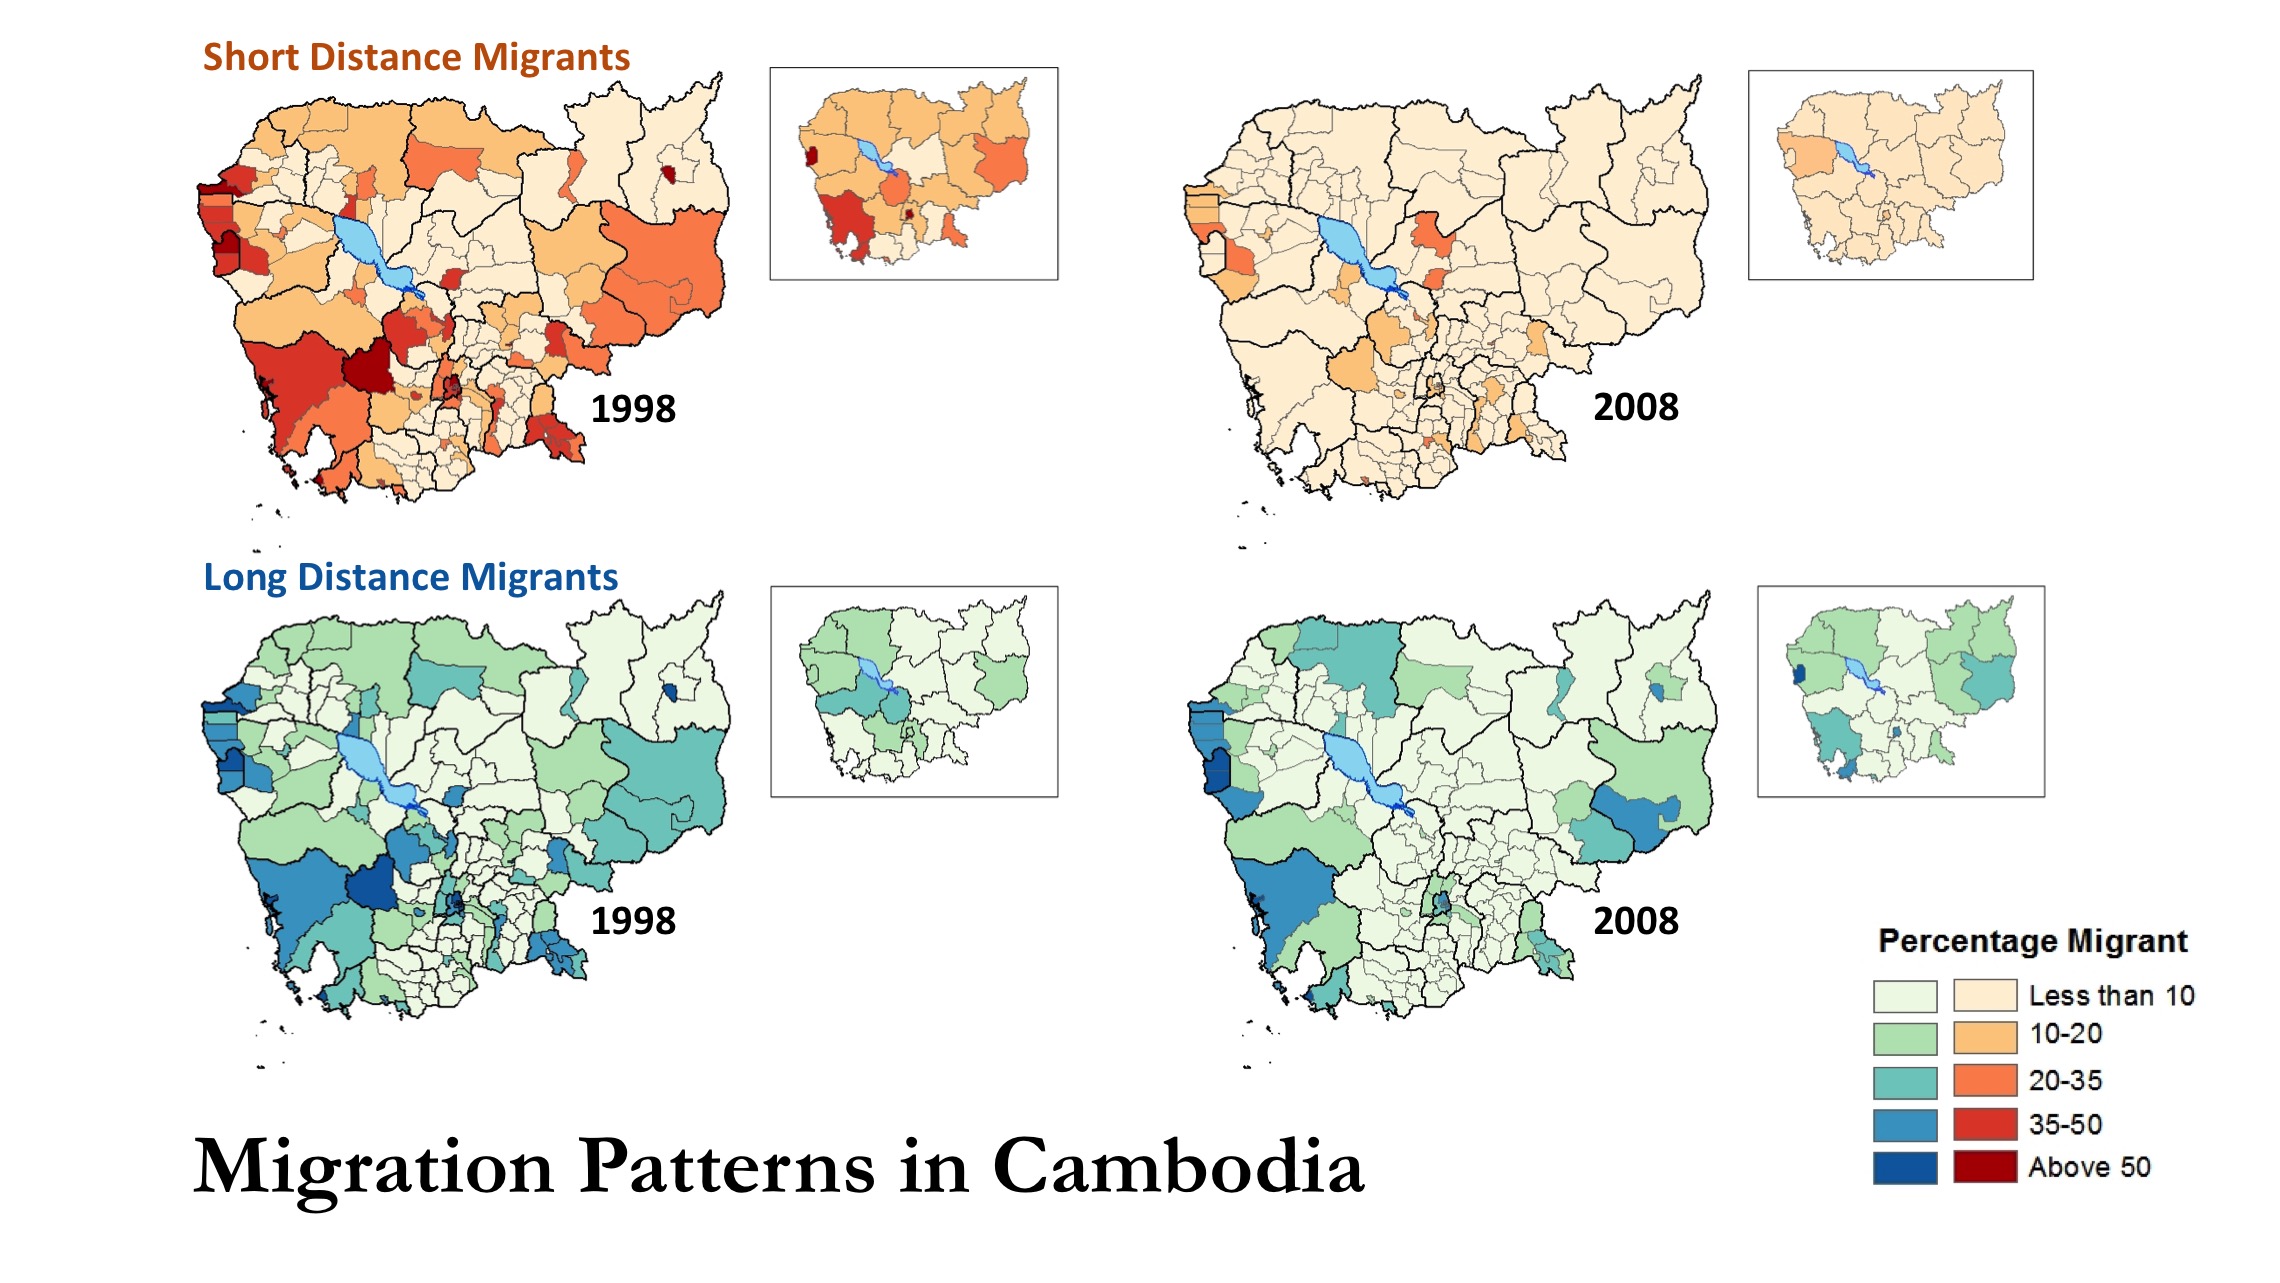
Geospatial contextual data describe features of the physical and social environment of a geographic area, and allow users to explore how contextual factors interrelate with individual characteristics and outcomes. For example, in their 2020 paper in Global Environmental Change, Mueller et al. estimated the effects that climate-related variables had on migration in Botswana, Kenya, and Zambia between 1989 and 2011. Often, however, these data are large, complex, and packaged in unfamiliar ways. With this new platform, IPUMS International simplifies the process of identifying and linking contextual data with our robust repository of census microdata.

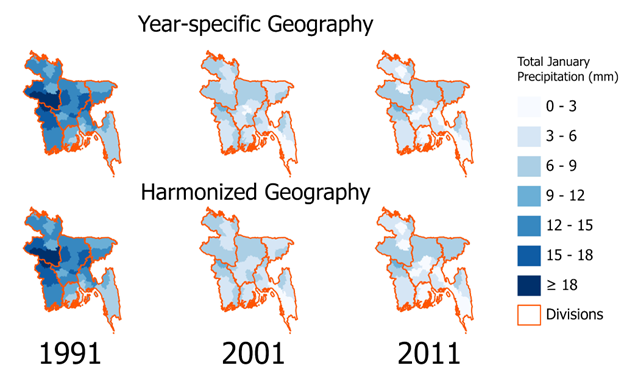
Geospatial contextual data can vary across space, time, or both and often do not obey administrative boundaries. IPUMS International is unique in offering spatiotemporally harmonized administrative geography variables, which when linked to time-variant contextual data, allow researchers to explore the relationship between social phenomena and temporally-dynamic geospatial data using a consistent spatial footprint.

For example, researchers might be interested in studying how changing January precipitation in Bangladesh from 1991-2011 is associated with social or demographic variables. In this case, harmonized geographic variables are ideal because of administrative boundary changes in Bangladesh between 2001 and 2011.
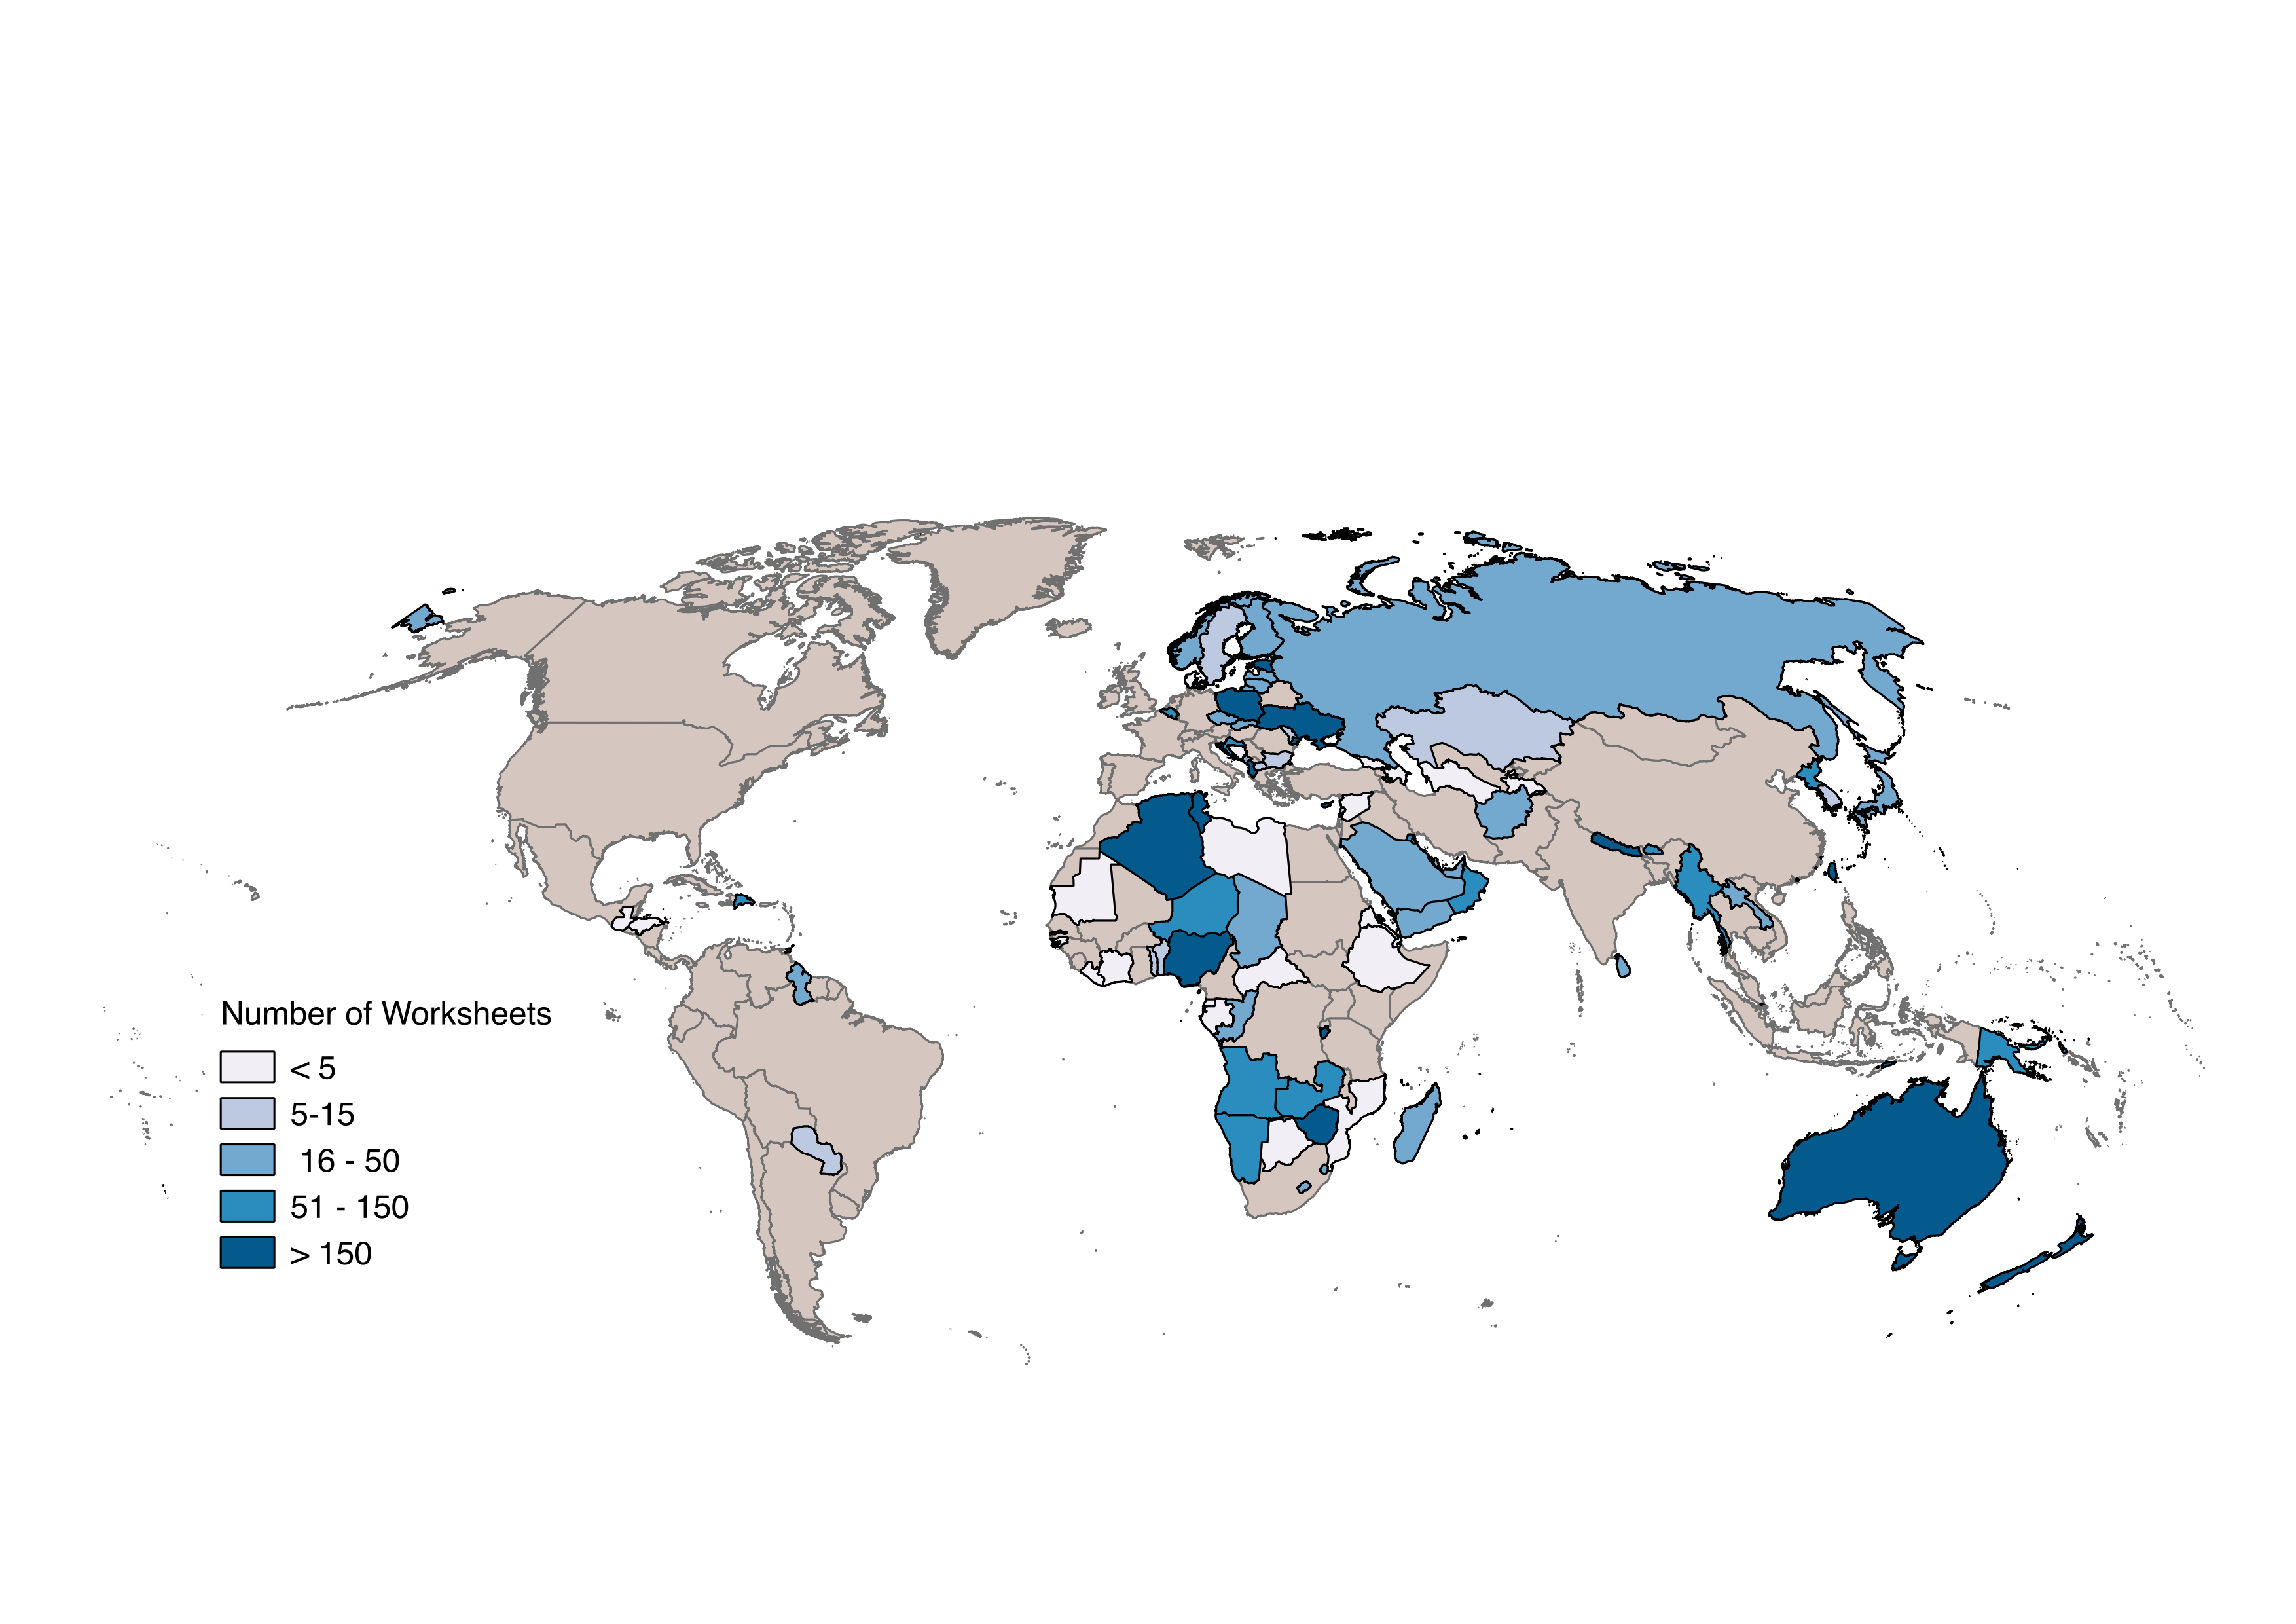
Maps of Bangladesh in 1991, 2001, and 2011 showing the total January Precipitation using year-specific geography and harmonized geography.
Bangladesh map showing January precipitation totals for each census year, showing the difference between year-specific and harmonized geography for measuring effects.

Continue reading…

Accessing IPUMS NHGIS in R: A Primer

By Finn Roberts & Jonathan Schroeder

R users have a powerful new way to access IPUMS NHGIS!

The July 2023 release of ipumsr 0.6.0 includes a fully-featured set of client tools enabling R users to get NHGIS data and metadata via the IPUMS API. Without leaving their R environment, users can find, request, download and read in U.S. census summary tables, geographic time series, and GIS mapping files for years from 1790 through the present. This blog post gives an overview of the possibilities and describes how to get started.

What you can do with ipumsr

Request and download NHGIS data

You can use ipumsr to specify the parameters of an NHGIS data extract request and submit that request for processing by the IPUMS servers. You can request any of the data products that are available through the NHGIS Data Finder: summary tables, time series tables, and shapefiles. You can also specify general formatting parameters (e.g., file format or time series table layout) to customize the structure of your data extract.

Once you have specified a data extract, you can use a series of ipumsr functions to:

  • submit the extract request to the IPUMS servers for processing
  • check on the extract status
  • wait for the extract to complete
  • download the extract as soon as it’s ready
  • load the data into R with detailed data field descriptions.

This workflow allows you to go from a set of abstract NHGIS data specifications to analyzable data, all without having to leave your R session!

Continue reading…

IPUMS IHGIS: Unlocking International Population and Agricultural Census Data

By Tracy Kugler

Nearly all countries throughout the world conduct population and housing censuses at least every ten years, and most also conduct agricultural censuses or surveys regularly. These censuses collect information on demographics, education, employment, housing characteristics, migration, agricultural land ownership, agricultural workforce, livestock, crops, and more. The resulting data can be used to study a wide range of questions, from the character of demographic transitions within and across countries, to utilization of irrigation, to educational trends among women. 

Unfortunately, this wealth of data has remained largely inaccessible to researchers. The data are typically published in reports as tables summarizing population characteristics. In recent decades, many of these reports have been published as PDF documents and made available on national statistical office websites. While the reports are available, data from a PDF document cannot be easily imported into a statistical or GIS package. Furthermore, the table structures are highly heterogeneous, both across countries and even within the same report.

The International Historical Geographic Information System (IPUMS IHGIS) is designed to provide easy access to these data in a way that researchers can easily use for analysis. In the early phases, IHGIS was known internally as “Project Mako,” named after the Mako shark, which has a global range, voracious appetite, and a reputation for a broad-ranging diet. Like the shark, IHGIS (née Project Mako) will encompass the world and ingest all kinds of data tables.

Continue reading…